Andrew Hecht
Summary
Lows in March 2016.
Higher highs and a bullish trading pattern.
The most recent WASDE was bullish.
90 cents follows the pattern of recent years.
Buy when it looks ugly.
Seven years ago, the price of cotton rose to its all-time high. The ascent of the fiber was nothing short of astonishing and shocked even the most bullish of market participants. In November 2008, the price of ICE cotton futures found a bottom at 36.7 cents per pound. In March 2011, the price had exploded to highs of $2.27 a rise of more than six-fold.
Before 2010, the price of cotton futures had never traded above $1.1720, but the rally in 2011 took the price to almost double that level. Many commodities take the stairs up and the elevator to the downside. However, cotton took the express route on the up and downside in 2011, as by the end of the year, the price had declined from its record peak to under $1 per pound once again.
Cotton continued to fall after reaching the lofty level in 2011, and lower highs and lower lows took the fiber to a bottom in March 2016. Cotton seems to experience lots of highs and lows during March and this month we celebrate the anniversary of the record high and most recent bottom in the cotton futures market.
Lows in March 2016
Gravity is a powerful force, and in March 2016 memories of all-time highs in the cotton market had faded in the market's rearview mirror as the price declined below the 60 cents per pound level.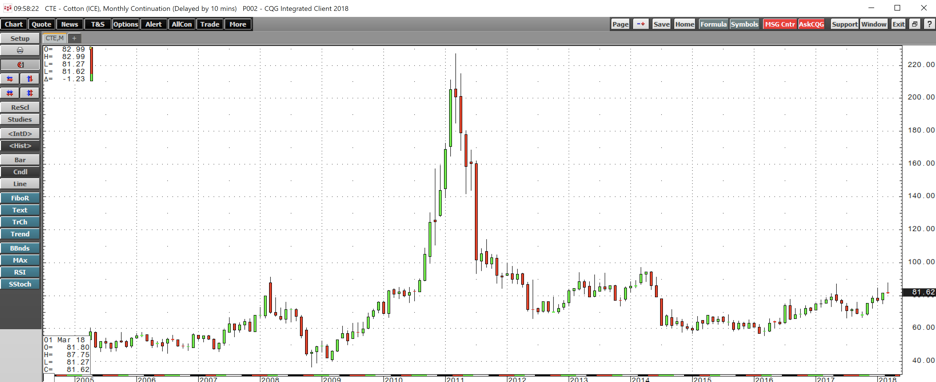
Source: CQG
As the monthly chart highlights, the price found a bottom at 55.66 cents per pound which turned out to be a significant low for the agricultural commodity. From 2011 through the first quarter of 2016, every rally turned out to be a selling opportunity in the cotton market. However, the trading pattern ended at a time when many other commodities found lows. In the world of commodities, late 2015 and early 2016 was a time when prices found bottoms.
China is the world's leading commodities consumer. 2016 began with a severe decline in Chinese domestic equity prices as the economy in the Asian nation cooled. The world had become accustomed to growth in China, and a slowdown spread across the world like a tsunami of selling in stocks and commodities markets leading to lower prices. China is one of the world's leading producers of cotton, but it is also a significant consumer of the fiber. Cotton found its bottom alongside most other raw materials. In early 2016, crude oil fell to lows of $26.05 per barrel and copper found its bottom at $1.9355 per pound. Since then the energy commodity and nonferrous metal have both appreciated significantly, and the same has been true for the price of cotton.
Higher highs and a bullish trading pattern
ICE cotton futures did not spend much time below 60 cents per pound, and by April 2016, the price was back above the 60 cents level.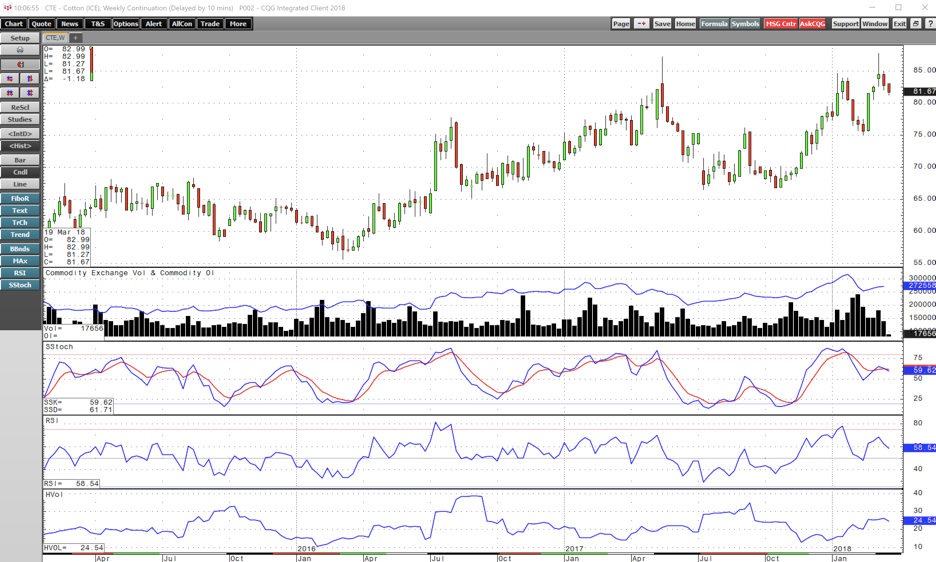
Source: CQG
As the weekly chart illustrates, the fiber embarked on a pattern of higher lows and higher highs starting in March 2016. By July of that year, the price had risen above the 70 cents level, rising to a high of 77.8 cents during the year. 2017 brought another milestone as cotton rallied back above the 80 cents level reaching a peak at 87.18 cents in May last year.
As the chart shows, in early March of this year, cotton rise to a marginal new high at 87.75 cents per pound on the nearby ICE futures contract and after the pullback and price correction that followed, it remains above 80 cents on Monday, March 19, trading around the 81.60 cents per pound level. Since the lows in 2016, the path of least resistance for the price of cotton has been higher, but it has been a bumpy ride for those with long positions as cotton can be a highly volatile raw material market. As the price moved higher, open interest has been increasing and reached its most recent high at 317,392 contracts at the start of this year. The level was an all-time high for the metric, and a rise in open interest when the trend is higher is typically a technical validation of the bullish trading pattern.
The most recent WASDE was bullish
Each month the agricultural tend to take their marching orders from the data released by the U.S. Department of Agriculture in their monthly World Agricultural Supply and Demand Estimates report. The March WASDE was bullish for the price of cotton as it confirmed that production and inventories were falling and export demand from the United States had increased on a month-on-month basis.
The technical trading pattern has been bullish since the 2016 low, and fundamentals seem to be improving. Back in 2016, cotton stocks in the United States and China stood at levels where there was enough of the fiber in storage to manufacture two pairs of jeans for every man, woman, and child on our planet. Since then, the stocks have declined adding support to the price of the fiber.
90 cents follows the pattern of recent years
Cotton found a low at under 60 cents in 2016, and the recovery that followed took the price to above 70 cents that year. In 2017, cotton futures tested above the 80 cents per pound level and then declined back to just under 66.50 cents. The low from July 2017 at 66.49 cents on the continuous contract remains the critical technical support for the cotton market.
So far in 2018, cotton has risen to a marginal new high at 87.75 cents earlier this month, but the price has pulled back to 81.60 cents. Nearby cotton futures have traded in a range from lows of 75.11 to highs of 87.75 in 2018 and are now at the midpoint of that trading range. On the weekly chart, technical metrics for price momentum and strength are close to neutral readings, but the pattern of higher lows and higher highs remains intact. I believe that we will see the fiber trade above the 90 cents per pound level in 2018 and it is only a matter of time before cotton mounts the strength to rally to a higher high and new milestone.
Buy when it looks ugly
A pullback is now underway in the ICE cotton futures market, and that could be an excellent opportunity to begin a program of scale-down buying in preparation for cotton's eventual rise to 90 cents. Cotton tends to be a highly volatile and illiquid commodity once it gets going on the up or downside. It is very difficult to hop on a short-term trend in the cotton market as they often occur at what amounts to a blink of an eye. Before you know it, the move comes to an end, and many market participants often make the mistake of entering the market on the long side at times when they should be using strength to take profits on existing positions. The bottom line when it comes to cotton is that it is typically best to buy this commodity when it looks bad and sell it when it looks best.
For those who do not venture into the highly leveraged ICE cotton futures or options market, the iPath Bloomberg Cotton ETN (NYSEARCA:BAL) offers an alternative. Barclays will delist the product in April and replace it with BALB. Both products have limited net assets of under $10 million, and the more active BAL trades only around 4,126 shares on an average day. The liquidity in the ETN products reflects the limited liquidity in the cotton futures market, so investors and traders need to select entry and exit points when using these vehicles carefully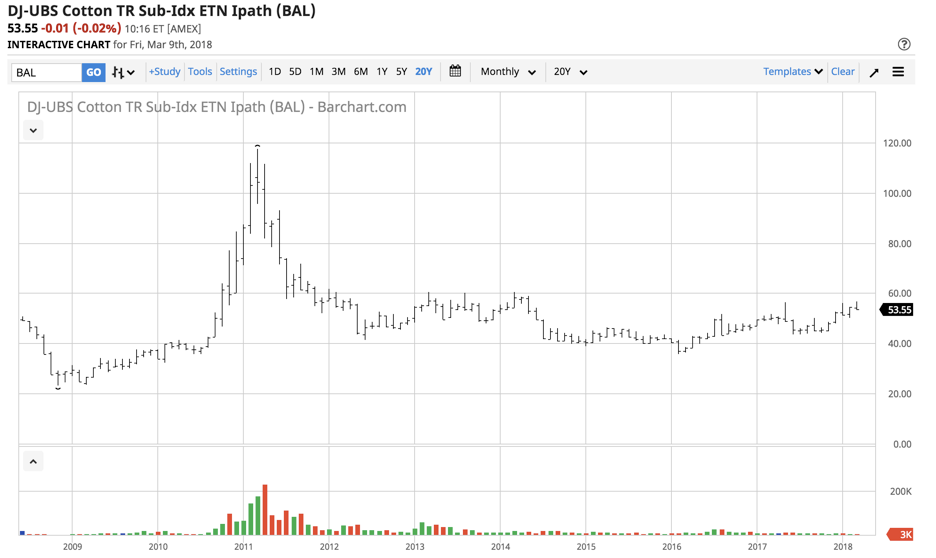
Source: Barchart
As the chart of BAL dating back to 2008 highlights, the ETN has traded in a range from lows of $23.19 to highs of $117.33. At $53.55 per share on March 19, it is closer to lows than highs, and the trend since March 2016 has been higher. BAL has done a reasonable job replicating the price action in the cotton futures market. It is likely that the replacement vehicle, BALB, will do the same.
I believe cotton will work its way to the 90 cents per pound level before the end of 2018. Now that the price is correcting towards 80 cents once again in the futures market, it could be an excellent time to begin building a long position in the fluffy fiber. Look for BALB to build critical mass over coming days and weeks. When the net assets and daily volume exceed BAL, it will be safer to use this market product.
The Hecht Commodity Report is a must-read…
I believe we're on the verge of a commodities super cycle. Do you know how to profit from it? I do, and I can help you navigate the turbulent commodities markets to make the most of the trends behind the trade. The Hecht Commodity Report on Marketplace provides subscribers with my weekly outlook, top picks, and bullish, bearish or neutral calls on over 30 individual commodities markets, including U.S. futures. I also make timely recommendations for risk positions in ETF and ETN markets and commodity equities and related options. There's also an active live chat, where I reply quickly to questions. If you want to build wealth with commodities, the Hecht Commodity Report is required reading.
Disclosure: I/we have no positions in any stocks mentioned, and no plans to initiate any positions within the next 72 hours.
I wrote this article myself, and it expresses my own opinions. I am not receiving compensation for it (other than from Seeking Alpha). I have no business relationship with any company whose stock is mentioned in this article.
Additional disclosure: The author always has positions in commodities markets in futures, options, ETF/ETN products, and commodity equities. These long and short positions tend to change on an intraday basis.
