
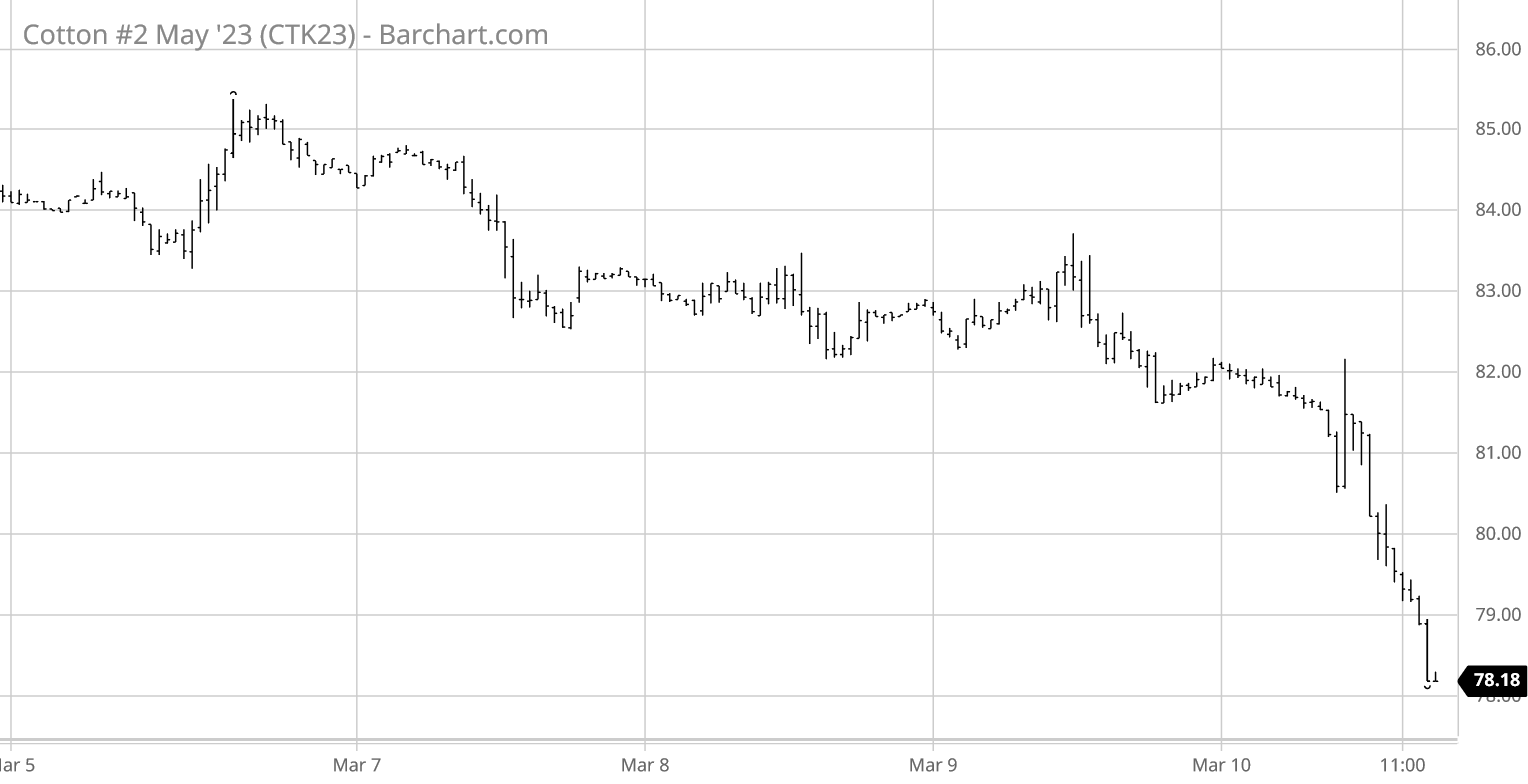
For the week ending Friday, March 10, ICE cotton futures started sideways, shifting to a downward glide that crashed in a limit-down slide (see chart above courtesy of Barchart.com). The most active May’23 contract settled Friday down four cents at at 78.18 cents per pound, while the new crop Dec’23 settled at 80.25 cents. The pattern of CBOT corn, CBOT soybeans, and KC wheat all followed a similar weekly downtrend as ICE cotton futures. The U.S. dollar index trended gradually lower most of the week, punctuated by an upshift on Tuesday and a plunge on Friday. Weaker commodity markets on Friday were in concert with broader “risk off” selling of stocks.
Chinese cotton prices were flat-to-lower across the week, as was the A-Index of world prices. Cotton-specific influences this week included neutral (U.S.) and bearish (World) adjustments to USDA’s cotton supply and demand numbers. The most recent observation (through March 2) revealed weekly U.S. export sales that were relatively poor while actual export shipments climbed to the weekly average level. USDA’s weekly summary of the U.S. market continued to reflect a mix of inactive (Southeast, Delta, Western markets) to active (Texas markets) spot physical trading, along with reportedly light to very light demand.
The pattern of ICE cotton futures open interest was mixed across the week. Unfortunately, the most recent confirming snapshot of speculative positioning is several weeks old due to delays from CFTC, who is playing catch-up with the data.
For more details and data on Old Crop and New Crop fundamentals, plus other near term influences, follow these links (or the drop-down menus above) to those sub-pages.