Andrew Hecht
Summary
A decline on trade.
The lowest price level since 2016.
The September WASDE could provide some direction.
Levels to watch in the fluffy fiber.
BAL for those who do not trade futures.
I do much more than just articles at Hecht Commodity Report: Members get access to model portfolios, regular updates, a chat room, and more.Get started today »
In March 2011, the price of cotton futures on the Intercontinental Exchange rose to the highest level in history at $2.27 per pound. Before 2010, the price of the fluffy fiber never exceeded $1.1720 per pound, the 1995 peak. A shortage of cotton took the price to the lofty level in 2011. In response to a price that was almost double the prior peak, many garment manufacturers substituted synthetic fibers for cotton leading to an incredible price decline.
Cotton producers increased output dramatically when the fiber moved to over $2 per pound, and inventories grew. At one point, there was enough cotton in storage in the US and China to manufacture two pairs of jeans for every man, woman, and child on our planet. By March 2016, the price of cotton reached a low at 55.66 cents per pound, over 75% below the 2011 peak.
The price of cotton recovered from the 2016 low and traded as high as 96.50 cents in June 2018. Since then, the price turned south, and in August 2019, it came within one penny of the 2016 low.
The most direct route for a risk position in the cotton market is via the futures and futures options that trade on the Intercontinental Exchange. The iPath Series B Bloomberg Cotton Subindex Total Return ETN product (BAL) provides an alternative for market participants looking to participate in the volatile cotton market.
A decline on trade
The cotton futures market is the one soft commodity that is in the crosshairs of the trade war between the US and China. The rise of the dollar against other world currencies has added insult to injury for the fluffy fiber futures. On Tuesday, September 3, the dollar index rose to a new high at 99.33, the highest level for the US currency since May 2017.
However, it is trade that is the noose around cotton’s neck these days. The escalation of the trade war on August 1 sent the price of cotton lower. When the US slapped new tariffs on Chinese exports to the US and China retaliated, the price of cotton dropped.
Source: CQG
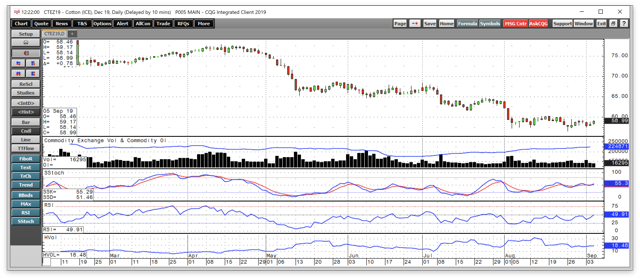
The daily chart of the active month December cotton futures on ICE were trading at over 63 cents per pound at the end of July. In early, August the price of the fiber declined reaching its most recent low at 56.59 cents on August 26. On Thursday, September 5, cotton futures had recovered to around 59 cents on the back of positive news on trade as China and the US will continue to work on a solution to the current standoff.
The drop to the lowest price since 2016 occurred in early August, and since August 5, the price has traded in a range between 56.59 and just over 60 cents per pound. Price momentum and relative strength on the daily chart are a bit above neutral territory as the price stabilized and settled into a trading range. Open interest, the total number of open long and short positions in the cotton futures market has increased from the 175,000-contract level in late June to over 224,000 contracts at the beginning of September. Rising open interest and falling prices are typically a technical validation of a bearish price trend in a futures market. Daily historical price volatility at under 19% reflects the current trading range for the fiber futures.
Both the US and China are significant producers of cotton. China and India produce the most cotton in the world, while the United States is the third leading producer of the soft commodity. China is among the world’s top three leading importers of cotton, while the US is the top exporter. Therefore, the trade war has distorted the balance of trade as Chinese imports of US cotton has ground to a halt weighing on the price of cotton futures.
The lowest price level since 2016
At the most recent low, the price of cotton declined to a low at 56.19 cents per pound in the futures contract for nearest delivery, the lowest price since March 2016.
Source: CQG
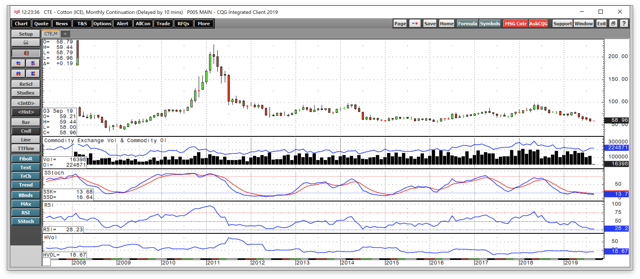
The monthly chart shows that the price of the fiber fell to a level that was only 0.53 cents above the March 2016 low when global cotton inventories swelled to historically high levels. The increase in output following the 2011 record high caused stockpiles to grow. These days, the trade war has distorted the flow of cotton around the globe. At the same time, the slowdown in China’s economy has reduced demand for cotton.
The monthly chart displays an oversold condition when it comes to both price momentum and relative strength indicators.
The September WASDE could provide some direction
The August World Agricultural Supply and Demand Estimates report from the US Department of Agriculture told the cotton market that 2019/2020 beginning stocks increased along with production, exports, and ending stocks. The USDA increased the 2019 crop by 2% to 22.5 million bales. However, the WASDE said that global consumption led to increased global inventories. Consumption in China, India, and Uzbekistan declined on the back of the slowdown in the worldwide economy.
We are likely to hear more of the same from the USDA next week when the agency releases its September WASDE report on Thursday, September 12, at noon EST.
Any surprises could cause some volatility in the cotton futures market, but the current price and recent trading range suggest that the market is braced for another bearish report.
Levels to watch in the fluffy fiber
The monthly chart shows that the critical level of technical support for the cotton futures market stands at the March 2016 low at 55.66 cents per pound. The 2016 bottom was the lowest price for the fiber since 2009. If cotton were to fall below the lowest price, the price action could become sloppy on the downside. The next level of technical support stands at the 2008 bottom at 36.70 cents per pound. Cotton can be a highly volatile commodity at times, and the current environment of protectionist policies and weakening economic conditions could drive the price down for a test of 50 cents or lower. However, 60.12 cents is the first line of defense on the upside in the cotton futures market. On the December futures contract, 60.25 is the level to watch.
BAL for those who do not trade futures
On the bullish side of the cotton market is the growth in the number of consumers on our planet. In 2001, the price of cotton fell to only 28.20 cents per pound. In 2000, the global population stood at six million people. Over the past two decades, it has grown by over 26.5% to over the 7.595 billion level. At the same time, wealth in China, the world’s most populous nation, has increased exponentially over the past two decades. Therefore, even if the price of cotton slips below the 2016 bottom, it is likely to find a higher low, given the demographic pressure on the demand side of the fundamental equation for the fiber. More people with more money in the world means that there is at least a 26% increase in the demand for clothing and other products that require cotton. The rise in wealth makes the demand side even higher than the population increase suggests.
I have been a scale-down buyer of cotton futures and futures options and plan to add to any long positions on further price weakness over the coming weeks and months. A trade deal between the US and China would likely light a bullish fuse under the volatile cotton futures market which was flirting with the $1 per pound level in mid-2018. Moreover, any further decline in the price could cause production declines as growers plant crops with better returns on their acreage.
The most direct route for an investment position in the cotton market is via the futures and futures options that trade on the Intercontinental Exchange. However, the iPath Series B Bloomberg Cotton Subindex Total Return ETN product (BAL) is an alternative for those market participants who wish to participate in the cotton market without entering into the volatile and leveraged futures arena. The fund summary for BAL states:
“The investment seeks return linked to the performance of the Bloomberg Cotton Subindex Total Return. The ETN offers exposure to futures contracts and not direct exposure to the physical commodities. The index is composed of one or more futures contracts on the relevant commodity (the index components) and is intended to reflect the returns that are potentially available through (1) an unleveraged investment in those contracts plus (2) the rate of interest that could be earned on cash collateral invested in specified Treasury Bills.”
Source: Yahoo Finance
BAL has net assets of $10.52 million and trades an average of 5,043 shares each day. Both the cotton futures market and the BAL ETN product can be highly volatile as liquidity can be an issue at times.
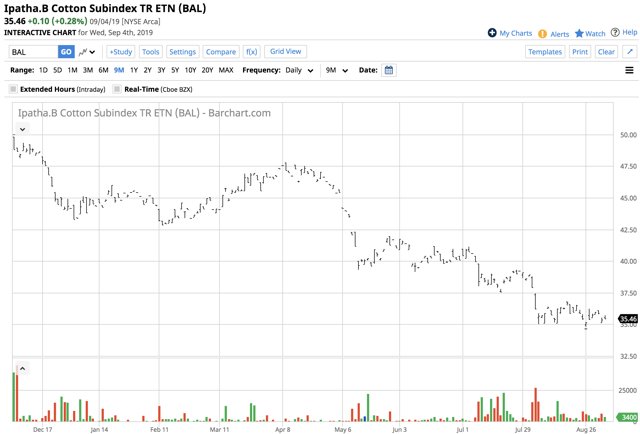
The most recent rally in the December futures contract in the cotton market took the price from the low at 56.59 cents on August 26 to a high at 59.30 on August 30 or a rise of 4.79%.
Source: CQG
As the chart shows, around the same period BAL moved from $34.80 to $36.24 per share or 4.14%. I would not leave any stop orders in the BAL product and would only use the instrument during hours when cotton futures are open for business. The limited liquidity could cause distortions in the price of the ETN product when market markers cannot hedge risks in the futures arena.
Meanwhile, BAL is the only game in town in the ETF/ETN markets. Cotton is sitting near the March 2016 low, and it looks like a sitting duck waiting to be shot. We may see the price of the fiber probe below the March 2016 following the September 12 WASDE report. The trade war continues to impact the flow of the fiber from the world’s leading exporter to the world’s top consumer. Protectionism distorts the prices and fundamentals of the commodities that move from points of production to regions of consumption around the globe. The cotton market is directly in the crosshairs and on the front lines of the trade war between the US and China. We could see lots of volatility in the cotton futures arena over the coming weeks and months.
The Hecht Commodity Report is one of the most comprehensive commodities reports available today from the #2 ranked author in both commodities and precious metals. My weekly report covers the market movements of 20 different commodities and provides bullish, bearish and neutral calls; directional trading recommendations, and actionable ideas for traders. I just reworked the report to make it very actionable!
Disclosure: I/we have no positions in any stocks mentioned, and no plans to initiate any positions within the next 72 hours. I wrote this article myself, and it expresses my own opinions. I am not receiving compensation for it (other than from Seeking Alpha). I have no business relationship with any company whose stock is mentioned in this article.
Additional disclosure: The author always has positions in commodities markets in futures, options, ETF/ETN products, and commodity equities. These long and short positions tend to change on an intraday basis.


