
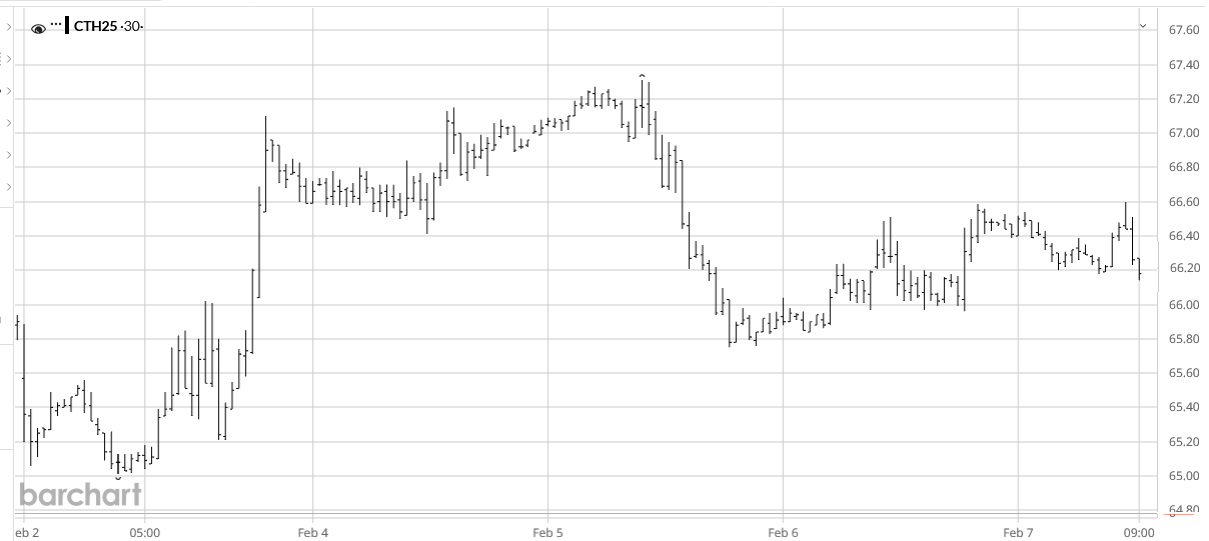
For the week ending Friday, February 7, the nearby Mar’25 ICE cotton futures contract stepped up from the weekly lows around 65 cents, traded sideways around 67 cents, then down-shifted and traded sideways between 66 and 67 cents per pound (see chart above courtesy of Barchart.com). The nearby Mar’25 settled Friday at 65.63 cents per pound, while the new crop Dec’25 settled the week at 68.61 cents. Chinese cotton prices, albeit mostly on holiday this week, were flat-to-mixed, as was the weekly pattern of the A-Index of world cotton prices and ICE cotton futures.
In other markets, nearby CBOT corn futures, CBOT soybeans and KC wheat futures all roughly followed a bumpy up-trending pattern across the week. U.S. dollar index glided down for a landing this week, which has the longer term appearance of a top to the post-Election Day rally that peaked January 13. Other macro influences (i.e., GDP, inflation, and interest rate policy) were typically mixed in their implication. The flurry of executive orders, actions, and rumors of actions from the new administration may be having an economic wet blanket effect.
There weren’t many cotton-specific influences this week to explain cotton futures price movements, other than the high volume rolling of index funds. Over 98% of the U.S. crop has been ginned and classed. The five weekly U.S. export sales reports in January were mixed. This includes two weeks with net upland sales below 200,000 running bales (January 2 and 30), another two weeks with net upland sales exceeding 300,000 (January 9 and 16), and one week inbetween (January 23). It looks bad for demand if the continuation of weak prices doesn’t stimulate higher net sales. The pace of 2024/25 export shipments remained below the needed weekly average pace to reach USDA’s target level of exports, though this is not unusual for this supply-dominated time of the year.
The dynamics of ICE cotton futures may also represent a wet blanket on the market. It remains true that unfixed call sales (by mills) are at an historically low level, perhaps reflecting the cautionary buying on the demand side. In terms of ratios, unfixed call purchases (by suppliers) outweigh unfixed call sales by two-fold across all contracts. In the nearby Mar’25 contract the imbalance is over three-fold in favor of unfixed call purchases. The implications of that imbalance are excess selling pressure on ICE futures when those March-based on call positions are fixed. Strictly speaking, this has less to do with the demand for cotton as much as it involves the demand for futures by commercial hedgers.
For the week ending February 6, the day-to-day levels in open interest in ICE cotton shifted higher and lower. As of Tuesday, February 4 (released Friday, February 7) the weekly snapshot of speculative positioning indicated another surge of outright short positioning with a whopping 10,345 new hedge fund shorts compared to the previous week, which swamped the 3,334 additional hedge fund longs. In addition, the index fund net long position contracted 1,457 contracts, week over week.
For more details and data on Old Crop and New Crop fundamentals, plus other near term influences, follow these links (or the drop-down menus above) to those sub-pages.
Source: TAMU