
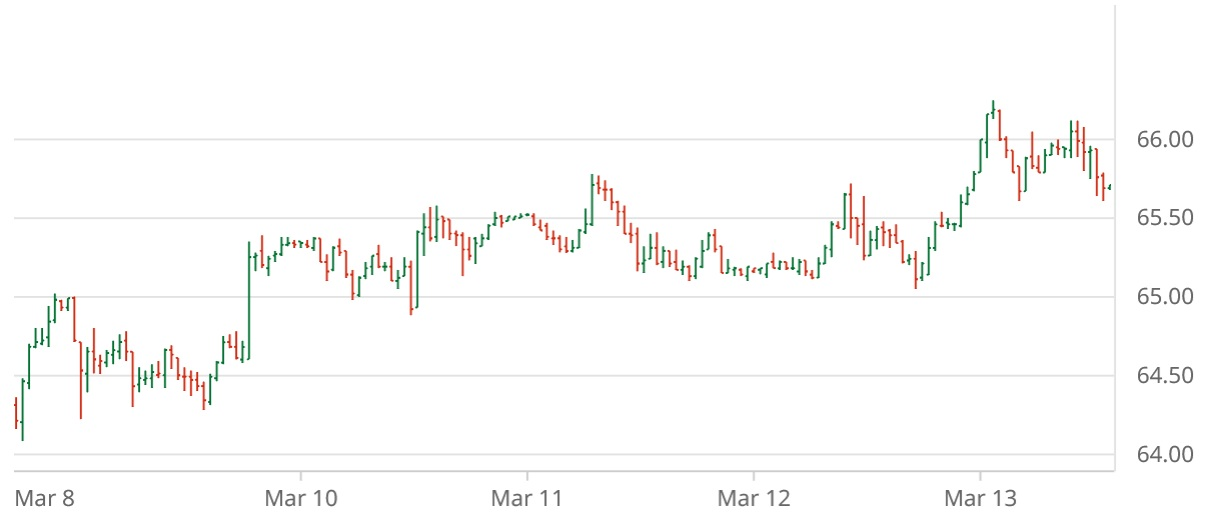
Through Friday, March 13, the most active ICE May cotton futures contract stair-stepped roughly a cent and a half higher across the week (see chart above courtesy of Barchart.com). On Friday the most active May’26 contract settled at 65.85 cents per pound while the new crop Dec’26 settled 33 points above the 70 cent threshold. Chinese cotton prices were mixed-to-higher across the week, while the A-Index of world cotton prices rose similarly to ICE cotton futures.
Other ag futures markets tracked a similar pattern to each other this week. CBOT corn and soybeans, along with KC wheat futures, all dipped early in the week, bottomed out, then partially recovered. ICE WTI crude oil futures peaked just under $120 per barrel, before declining sharply to $80 and then trading flat-to-higher. The U.S. Dollar Index started the week with a more gradual down-trend which switched to an uptrend through the rest of the week. Other macro influences (i.e., GDP, inflation, and interest rate policy) remained mixed in their expectation and implication for slow economic growth.
Cotton-focused news this week included mostly neutral supply and demand adjustments to USDA’s U.S. and world cotton balance sheets. The week ending March 5 saw improved, albeit unspectacular U.S. export sales. In contrast, U.S. export shipments through March 5 set a marketing year high. Reported demand indicators included inactive to active spot trading as well as light demand and light to moderate supplies, depending on the region. The supply question is probably resolved for the 2025 crop. As of March 1, NASS forecasted ginning of 99.5% of forecasted production as being ginned. Also, as of March 5, USDA AMS counted 99% of forecasted U.S. production as having been classed.
Through Thursday, March 12, the daily shifts in ICE cotton open interest were mixed-to-higher. In combination with mostly rising price settlements across the week, this had the appearance of new long positioning. Indeed, for the week ending Tuesday March 10, there was net long positioning in the form of over 8,269 hedge fund longs, reinforced by 1,524 fewer hedge fund shorts, and only partially countered by a 5,049 shrinkage of the index fund net long positions).
The dynamics of ICE cotton futures may also represent a wet blanket on the market. First, the rising certified stock levels in early 2026 could have been reflecting weak commercial demand for U.S. cotton. However, the certified stock level appears to have peaked, so the demand implications are less clear. Second, it remains true that unfixed call sales (representing potential/eventual futures buying by mills) are at an historically low level, perhaps reflecting the cautionary buying on the demand side. Having said that, unfixed call sales rose a bit in early March.
For more details and data on Old Crop and New Crop fundamentals, plus other near term influences, follow these links (or the drop-down menus above) to those sub-pages.
Source: TAMU