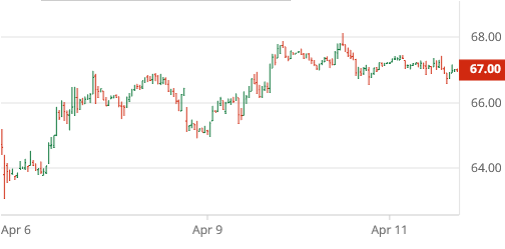
For the week ending Friday, April 11, ICE cotton futures trended higher from the lower 60s back to the upper 60s (see chart above courtesy of Barchart.com). The most active Jul’25 settled on Friday at 67.01 cents per pound while the new crop Dec’25 settled the week at 68.51 cents. Chinese cotton prices were mostly lower this week, while the A-Index of world cotton prices was more mixed.
In other markets, the most active CBOT corn and soybeans, as well as KC wheat futures, were all ultimately upward trending across the week. Corn followed an upward diagonal, soybeans was flatter before angling higher, and KC wheat gyrated slightly upward. The U.S. dollar index traded flat at first and then slid into a down-trend. Other macro influences (i.e., GDP, inflation, and interest rate policy) remained mixed in their expectation and implication. Dollar weakness was associated with currency and bond market reaction to expectations of a U.S.-Chinese trade war.
Cotton-focused market influences this week included neutral-to-bearish supply and demand projections from USDA. Probably all of the projected U.S. old crop production is ginned and classed as of early April (final ginning and classing reports will be published in May). January and February U.S. export sales reports belie a slight uptrend, but this has been stymied by weak export sales numbers since mid-March. The pace of 2024/25 export shipments continue above the weekly average level needed to reach USDA’s target level of exports (10.9 million bales).
For the week ending April 10, the day-to-day shifts in ICE cotton open interest reflected liquidation, i.e., declining open interest across the week. The coincidence of this pattern with mostly higher price settlements gave the appearance of short covering, although it is harder to tell with the massive level of fund rolling. Indeed, Tuesday’s weekly snapshot of speculative open interest showed a whopping 14,303 fewer hedge shorts, week over week. This was partially offset by a 7,227 reduction in hedge fund longs, compared to the previous week. In addition, the index trader net long position decreased slightly by 93 contracts, week over week.
The dynamics of ICE cotton futures may also represent a wet blanket on the market. It remains true that unfixed call sales (by mills) are at an historically low level, perhaps reflecting the cautionary buying on the demand side. In terms of ratios, unfixed call purchases (by suppliers) outweigh unfixed call sales by almost two-fold across all contracts, as of April 4.
For more details and data on Old Crop and New Crop fundamentals, plus other near term influences, follow these links (or the drop-down menus above) to those sub-pages.
