By Adam Harris, Trade With Precision
Given the general ongoing US political malaise, and market consensus on a rate cut by the Federal Reserve this week, I have decided to avoid Currencies and Equities this week in order to allow any market reaction to play itself out.
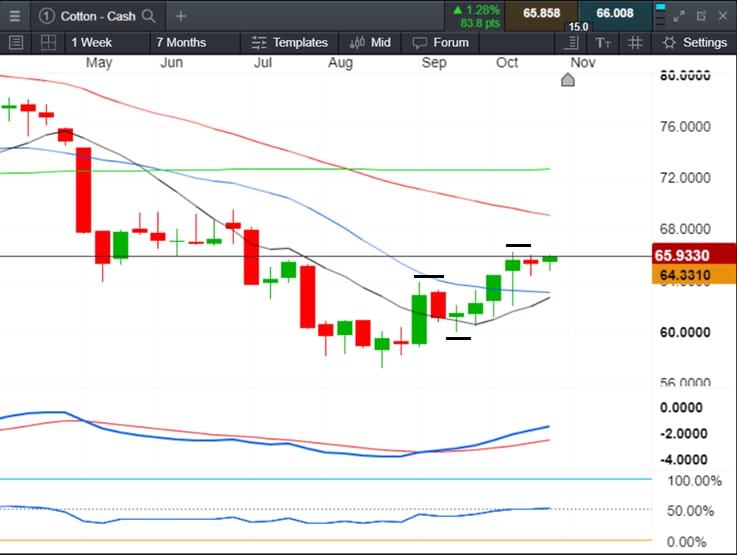
Instead, I’m looking at Cotton. On the weekly timeframe I’m observing an uptrend with higher-highs and higher-lows in place that began forming in mid-August this year. Although the moving averages (MAs) are not in the correct order yet, both of the momentum indicators, MACD and RSI, are bullish and could support price action.
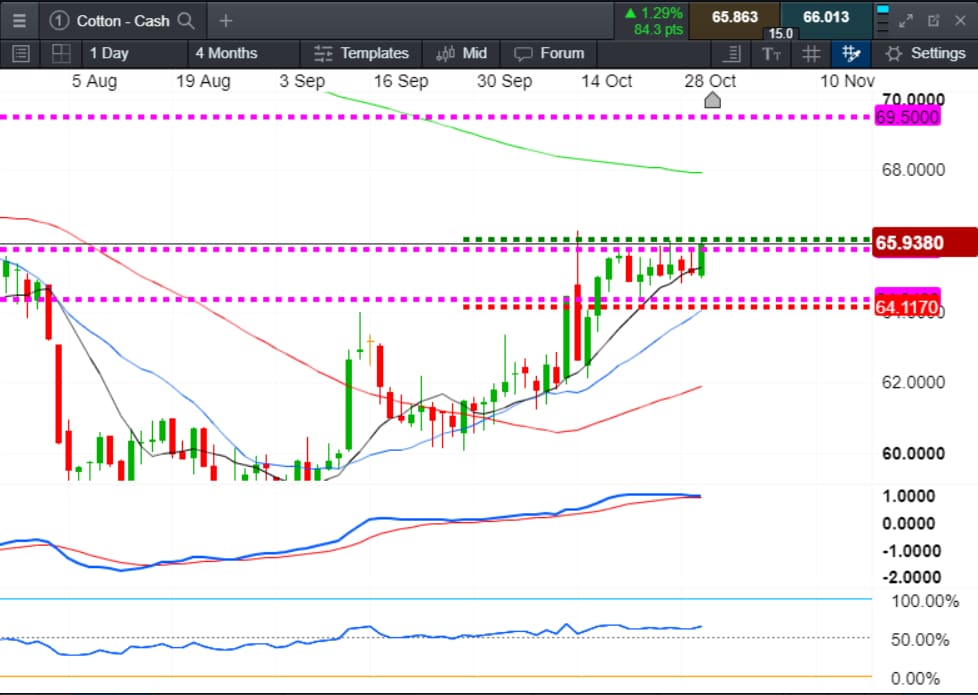
When looking at the daily chart below, price action is consolidating sideways, and at the time of writing, is now situated in the buy zone area of the 10 & 20 simple MAs. The MAs are also in the correct, bullish order, and price is encountering resistance with the formation of a flat level along the top of price action at 65.938.
Price itself is also in an uptrend with higher-lows into the resistance level. The flat level has at least five touches, which meets my criteria for a breakout setup.
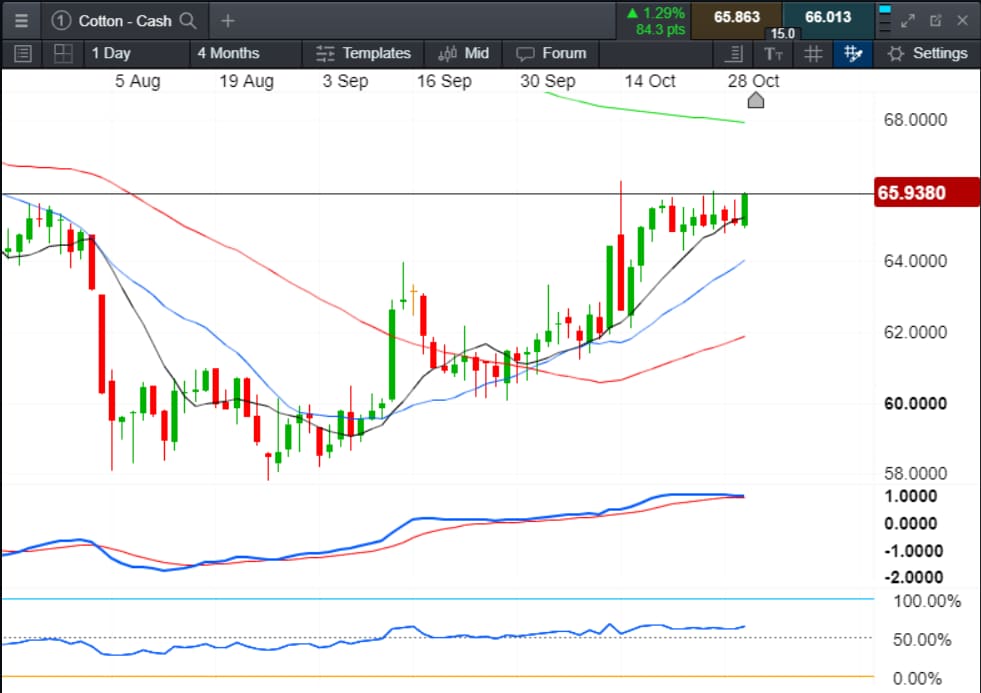
Importantly, the momentum indicators are flat and/or tending upwards, which is to say that they are in agreement with price and are convergent.
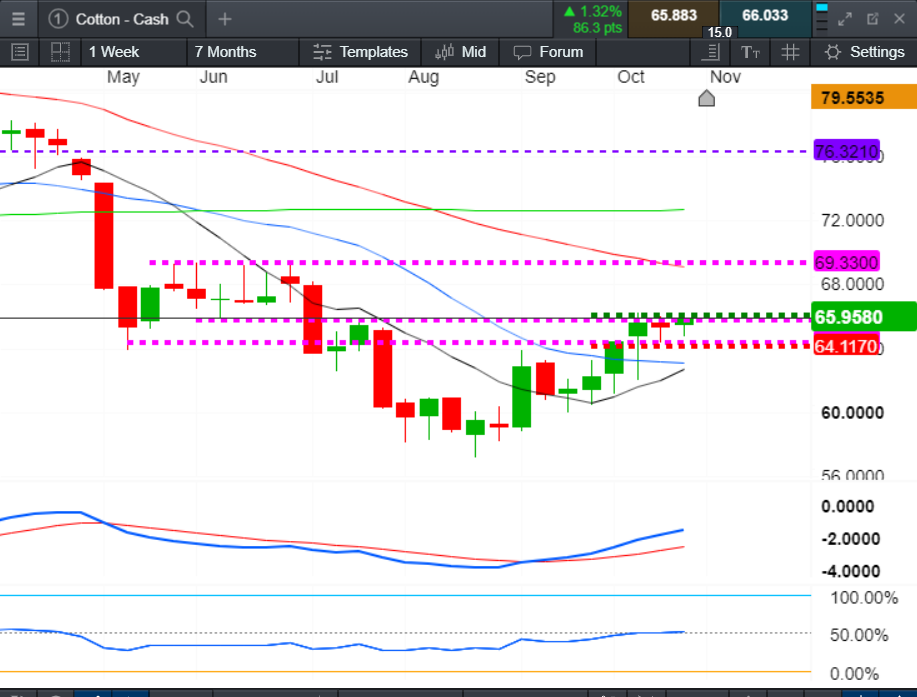
The weekly chart above shows my key levels and this chart shows little or no obstruction from my entry up to the potential resistance at 69.33.
On the Daily chart below, my entry is placed above the defined flat level at 66.05, and my stop-loss just below a soft level of historical support at 64.34
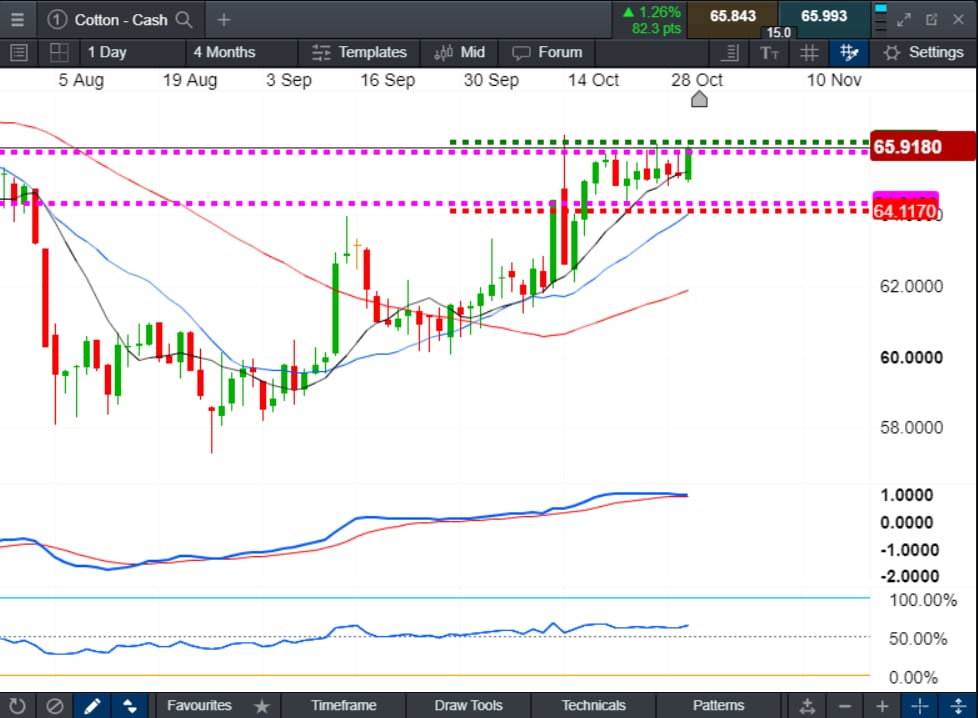
This next chart shows the clear run towards the 70.00 level. However, I still have no guarantee that price will achieve this level without unexpected volatility, so my trading plan is to take partial profits at my 1:1 and 2:1 targets.
My standard approach is to split my trade risk into two separate orders, with their own take-profit levels put in at the time of placing the trader order. Should the move continue, I will trail my stop-loss behind each closed daily candle (5 points below the low).
Happy Trading.


