Summary
The fluffy fiber finds a floor.
Liftoff in October.
A pair of bullish WASDE reports.
A bumpy ride ahead.
90 cents per pound in 2018.
Before 2010, the price of ICE cotton futures dating back to 1972 never traded above $1.1720 per pound. A shortage developed in 2010 and 2011 that caused the price of the soft commodity to almost double from the previous high established in 1995. In March 2011, nearby cotton futures soared to a high of $2.27 per pound. Many in the industry on the consumer and producer sides of the market suffered. Consumers could not afford the high price, and producers who had hedged were financially buried from margin calls on short positions as the price rose to its all-time peak.
The rally in cotton from 2010 to 2011 caused garment manufacturers in China to change their behavior as they began to use synthetic fabrics in the place of the expensive fiber. As demand declined at the lofty price level, the price quickly pulled back. In September 2010, cotton was trading at a low of 89 cents per pound, and by March 2011, it reached $2.27. It took cotton six months to explode to the upside, but it came down even faster. Just four months after the high, in July 2011, cotton traded to a low of 93.5 cents per pound, and it entered into an almost five-year period of bear market trading until March 2016.
The fluffy fiber finds a floor
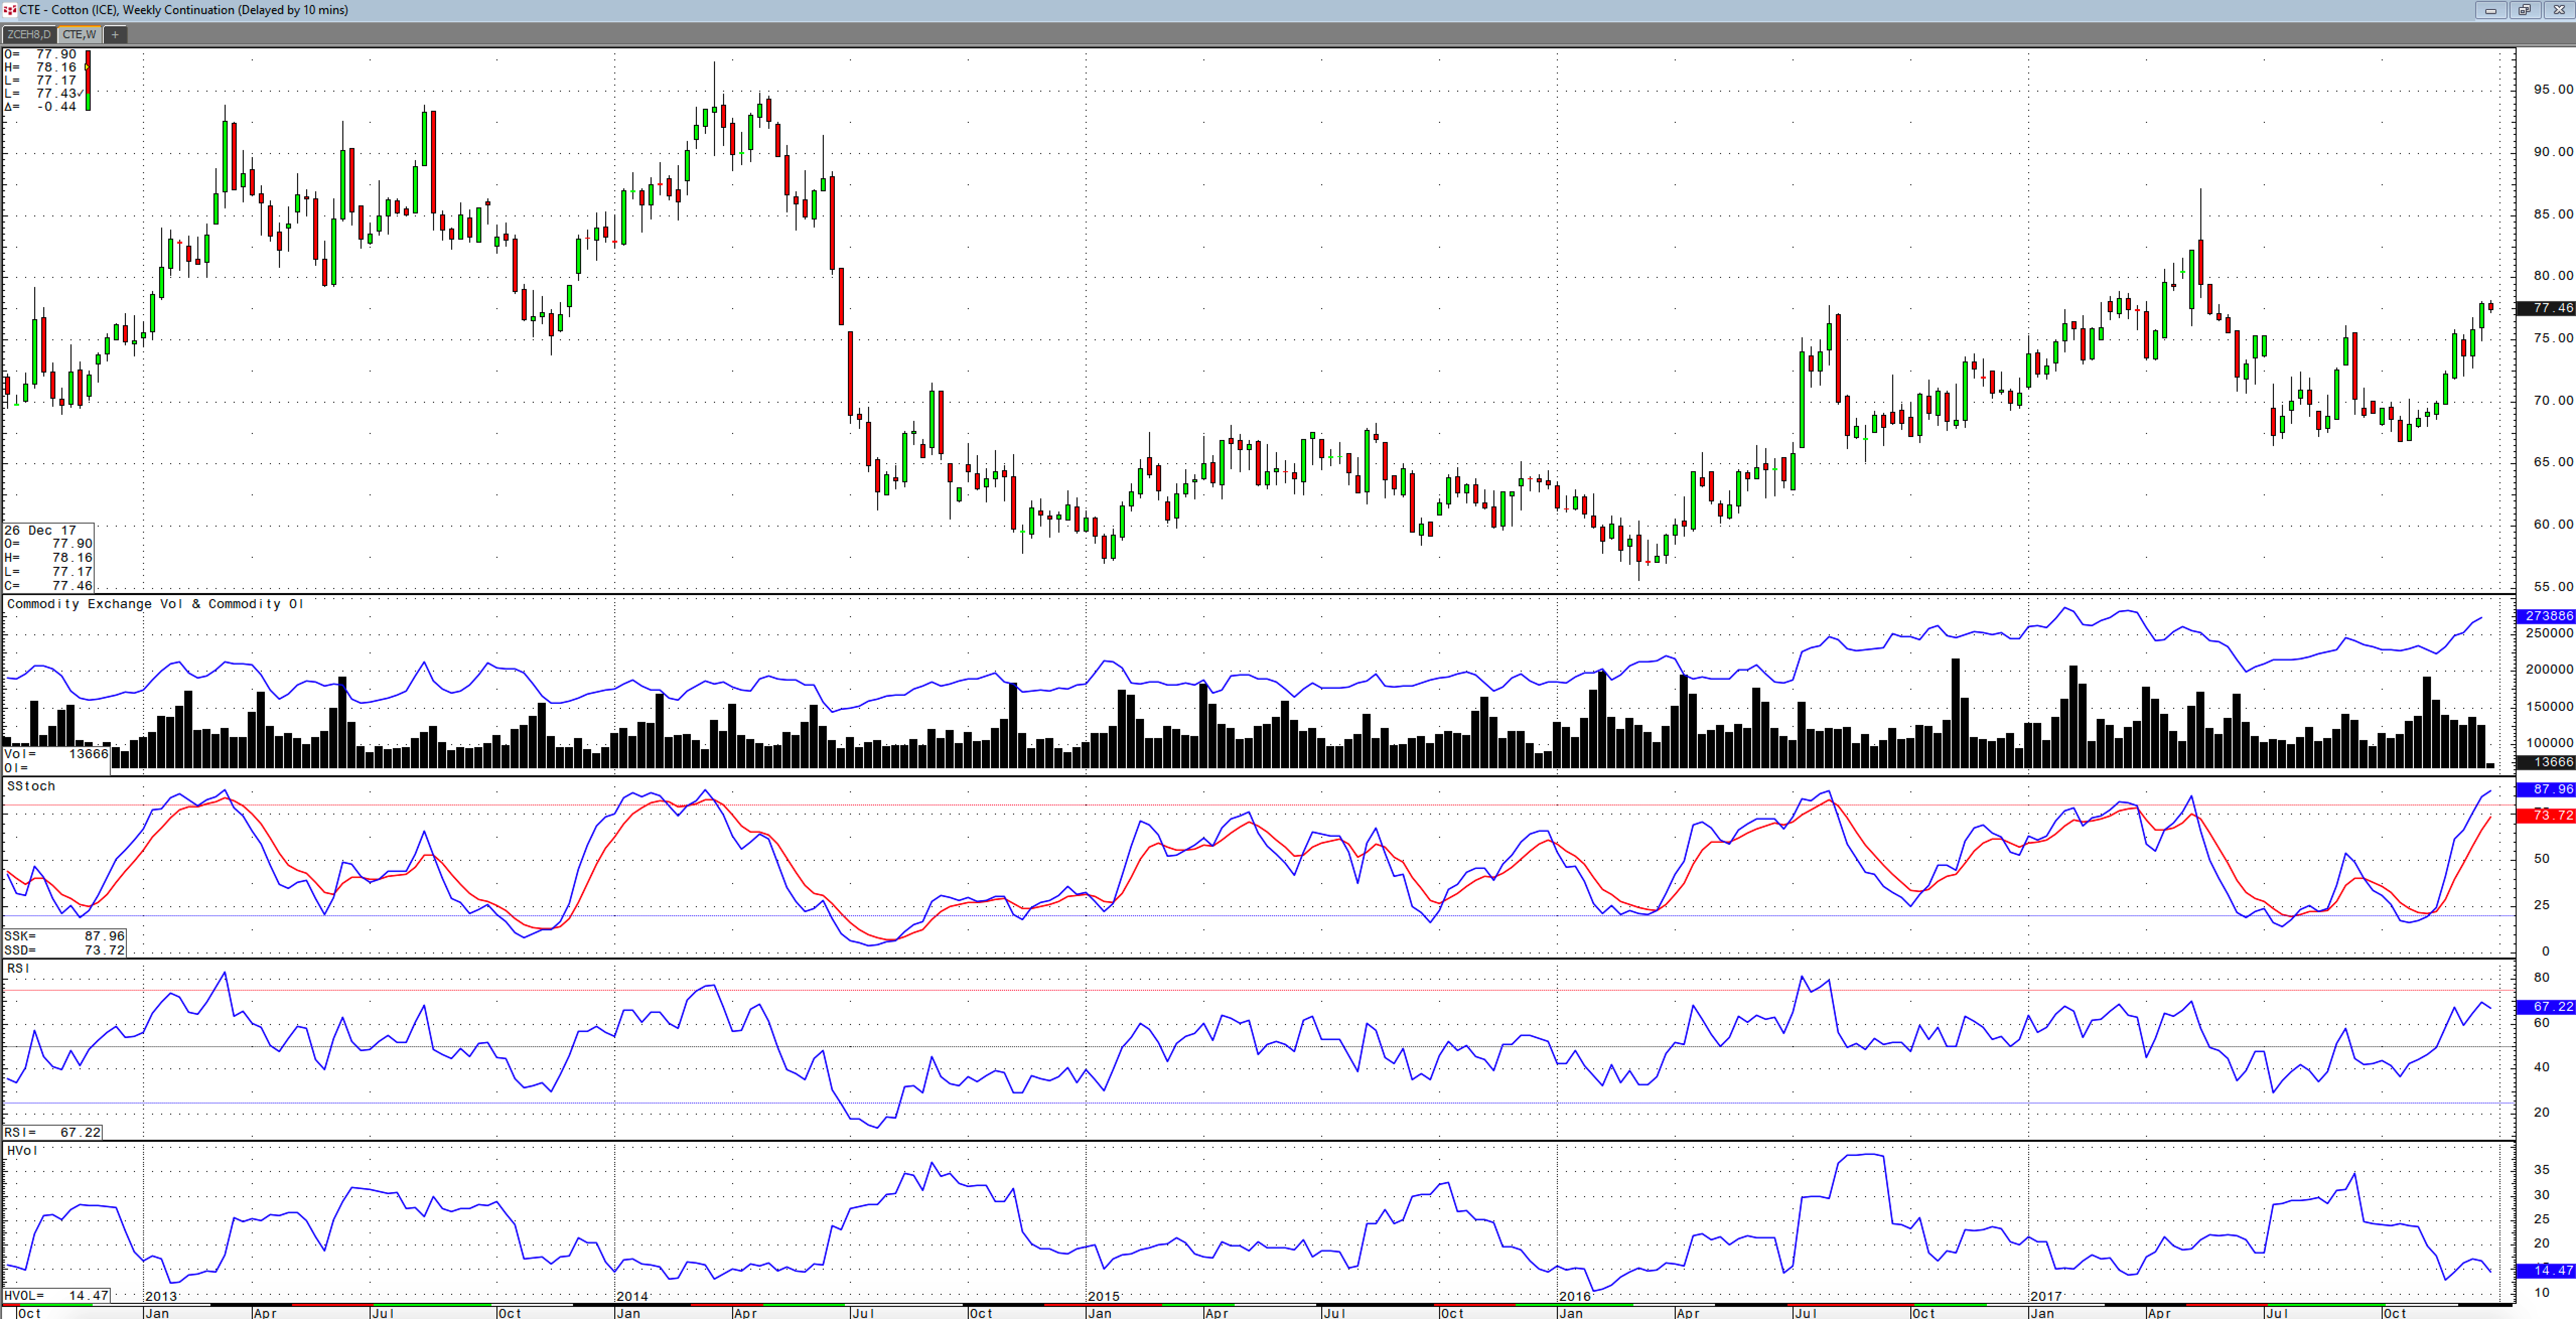
In March 2016, cotton finally found a bottom after bearish price action for almost half a decade.

As the weekly chart highlights, cotton fell to 55.66 cents per pound, $1.7134 or over 75% below its 2011 peak price in March 2016, and it began a pattern of higher lows and higher highs leading to a peak at 87.18 fourteen months later in May 2017.


