
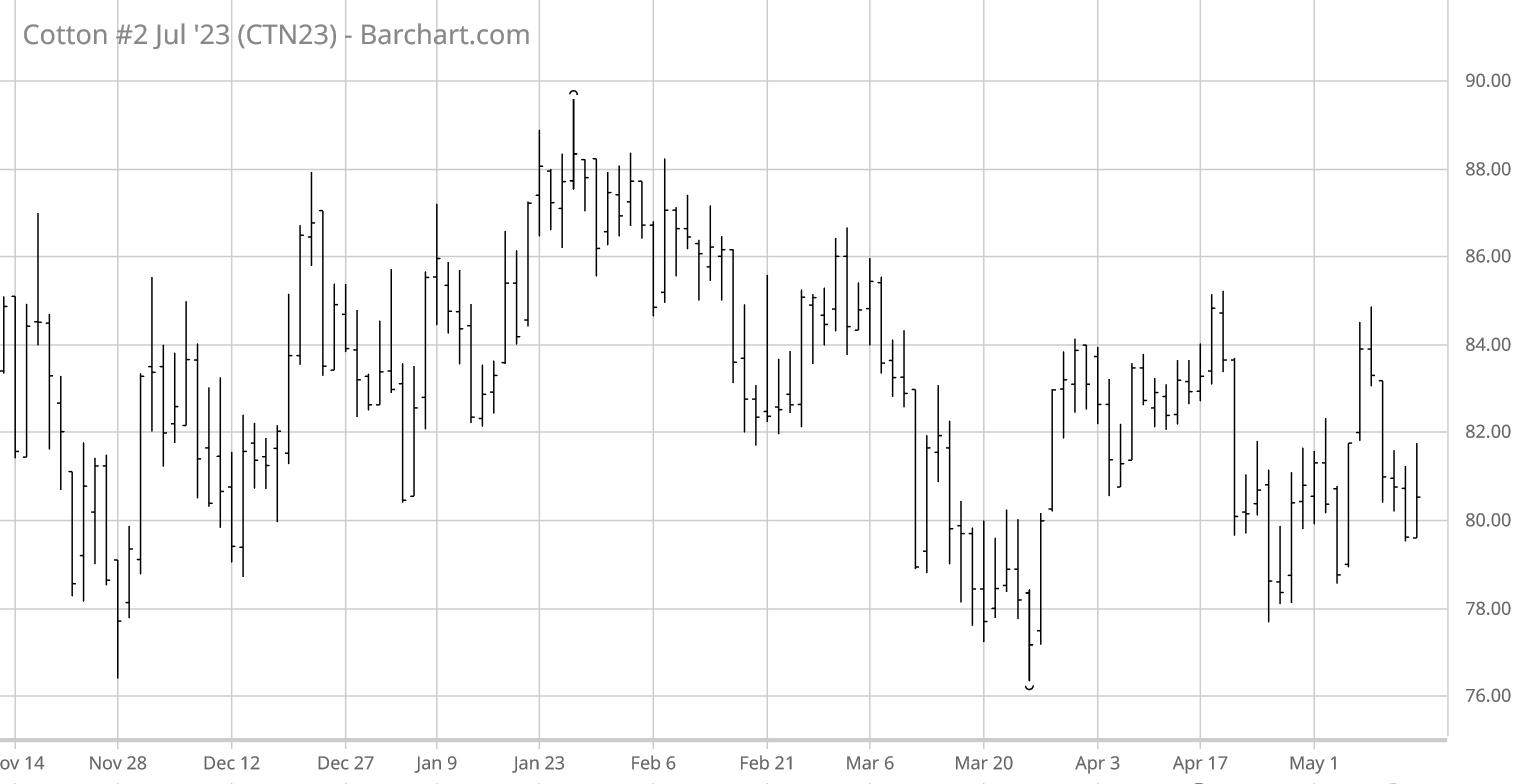
For the week ending Friday, May 12, ICE cotton futures gradually peaked, then slid, and gyrated sideways (see chart above courtesy of Barchart.com). The most active Jul’23 contract settled Friday at 80.53 cents per pound, which was up 91 points on the day, but down 27 points on the week. The new crop Dec’23 settled at 80.15 cents. The week saw downtrends in CBOT corn and soybean futures while KC wheat futures were flat leading into a post-WASDE spike. Chinese cotton prices were mixed across the week, as was the A-Index of world cotton prices.
Cotton-specific influences this week included bullish old crop estimates and new crop forecasts of world and U.S. cotton supply and demand numbers. This week saw yet more rain over Texas, with more in the forecast. U.S. export sales continued strong, as did actual export shipments. USDA’s weekly summary of the U.S. regional markets continued to reflect mixed spot physical trading activity and demand across the various U.S. regions.
ICE cotton futures open interest increased across the week, while futures settlements were mixed-to-lower. This has the appearance of additional short positioning. However, the regular Tuesday snapshot of speculative positioning (through May 9) actually revealed 799 more hedge fund longs and 6,909 net fewer hedge fund shorts, week over week. In addition, the index fund net long position grew by 1,622 contracts. So the data reflect the opposite of more short positioning, at least through last Tuesday.
For more details and data on Old Crop and New Crop fundamentals, plus other near term influences, follow these links (or the drop-down menus above) to those sub-pages.
