
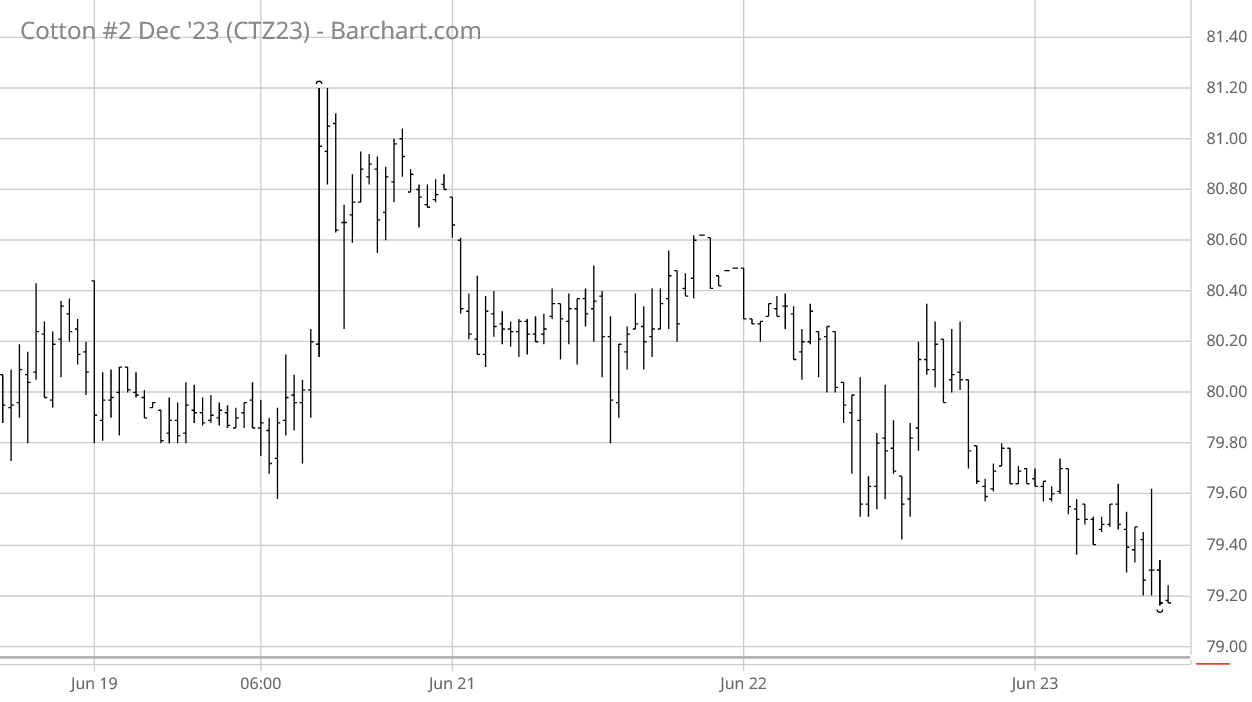
For the holiday-shortened week ending Friday, June 23, ICE cotton futures started off stronger, but then slipped back into the down-trend of the prior week (see chart above courtesy of Barchart.com). On Friday the most active Dec’23 contract settled 148 points lower on the day at 78.67 cents per pound. Chinese cotton prices also declined across the week, while the A-Index of world cotton prices was flat-to-higher. The June rallies in CBOT corn, CBOT soybeans and KC wheat futures appeared to peak this week.The U.S. dollar index followed a gradual uptrend across the week that got more volatile in its progression.
Cotton-specific influences this week included continued hot weather over Texas. The excess rains of the preceding month are likely having mixed effects in northwestern Texas. The statewide regional summaries (click here and scroll down) generally reflect the transition to hot conditions. The resulting production uncertainty is clouding the U.S. cotton supply/demand and market outcomes.
On the other side of the world, the southwest monsoon is beginning to catch up from it’s delayed progress over the Indian subcontinent. U.S. export sales continued weaker compared to last month and actual export shipments remained below the needed weekly average pace. Of course, hypothetically, the pattern of cotton sales and shipments can be “lumpy” if major buyers like China step in with large, late-breaking purchases. Meanwhile, USDA’s weekly summary of the U.S. regional markets continued to reflect mixed spot physical trading activity and very light to moderate demand, across the U.S. regions. Macro influences (i.e., GDP, inflation, and interest rate policy) remain a potential headwind to longer term cotton demand.
ICE cotton futures open interest had a mixed pattern across the week, while futures settlements were flat-to-lower. The the regular weekly snapshot of speculative positioning (through Tuesday, June 20) reflected short positioning with from 2,640 new hedge fund shorts, week over week. This was slightly reinforced by 774 liquidated hedge fund longs and 146 fewer index fund net longs, week over week.
For more details and data on Old Crop and New Crop fundamentals, plus other near term influences, follow these links (or the drop-down menus above) to those sub-pages.
