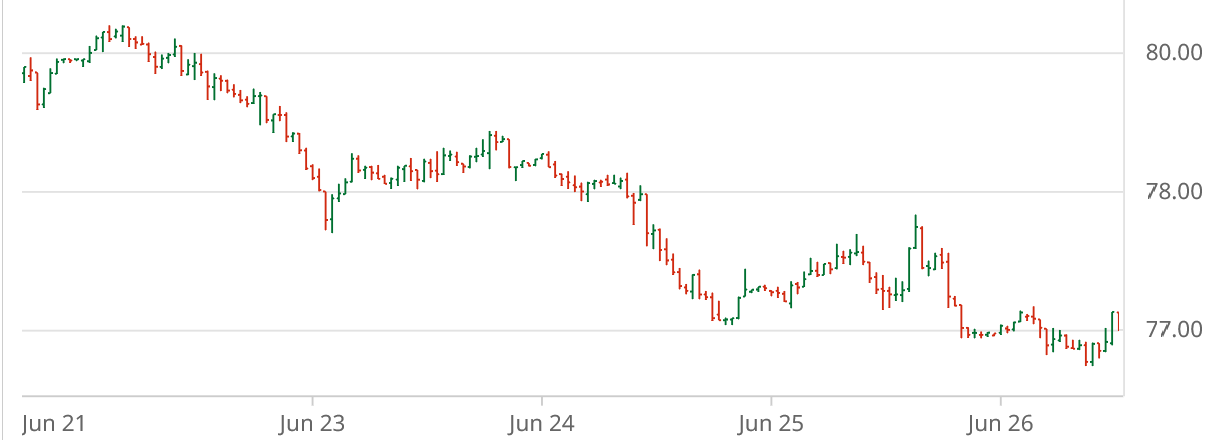
This week saw ICE cotton futures stair-step down from the 80-cent level on Monday to around 77 cents by week’s end (see Dec’26 chart above courtesy of Barchart.com). Chinese cotton prices declined across the week, while the the A-Index of world cotton prices was flat to lower.
Other agricultural futures followed similar paths for the week ending June 25. CBOT corn and soybeans, as well as KC wheat futures, all trended lower before either bouncing or at least flattening out. The ag futures markets all appeared to be following oil futures markets which weakened to pre-war levels in apparent response to the resumption of shipping traffic in the Strait of Hormuz. The U.S. dollar index inversely strengthened across the week before leveling off.
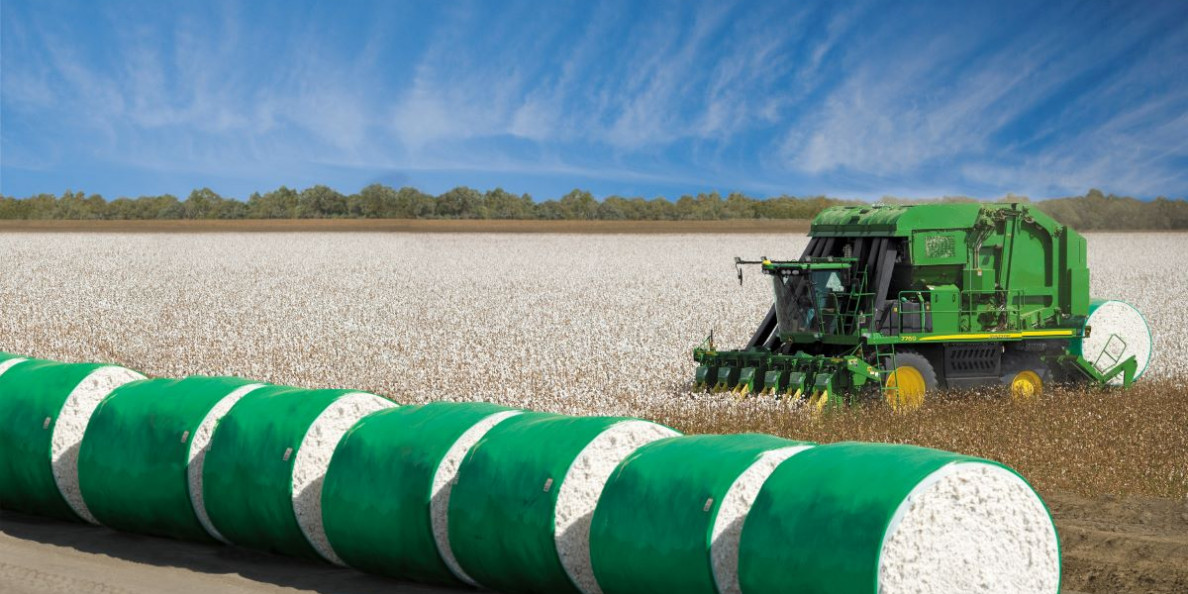
Cotton-focused news this week included an near-par pace of planting. Weekly U.S. cotton crop condition ratings remain relatively good, matching up with continued rainfall. U.S. export net sales as of June 18 were notably weak at only 83,900 bales of upland. Weekly U.S. cotton export shipments continued to slip below USDA’s export target level. Reported demand indicators included inactive to active spot trading, very light to moderate demand, and light to moderate supplies, all depending on the region. On the other side of the world, various influences (e.g., South Asian monsoon, and reduced world acreage, particularly in Australia) could paint a tighter global supply picture.
Through Thursday, June 25, the daily shifts in ICE cotton open interest decreased compared the previous day. The corresponding decline in daily price settlements gave the appearance of long liquidation. The most recent Tuesday speculative snapshot (represented by the CFTC’s CIT “Supplemental” report for June 23 actually showed more long positioning. Specifically, there were 5,637 more hedge fund longs, week over week. This was reinforced by a 1,610 decrease in hedge fund shorts compared to last week. Lastly, the index fund net long position expanded by 1,609 contracts, week over week.
The dynamics of ICE cotton futures may also represent a wet blanket on the market, but one that is perhaps lifting. The rising certified stock levels in early 2026, and again since April, could reflect weak commercial demand for U.S. cotton. It remains true that unfixed call sales (representing potential/eventual futures buying by mills) have been at a relatively low level, perhaps reflecting the cautionary buying on the demand side. But more recently, unfixed call sales have been stabilizing/rising (see red line in the chart below). This is bringing them more into balance with unfixed call purchases, and contributing to futures buying.
For more details and data on Old Crop and New Crop fundamentals, plus other near term influences, follow these links (or the drop-down menus above) to those sub-pages.
Source: TAMU