
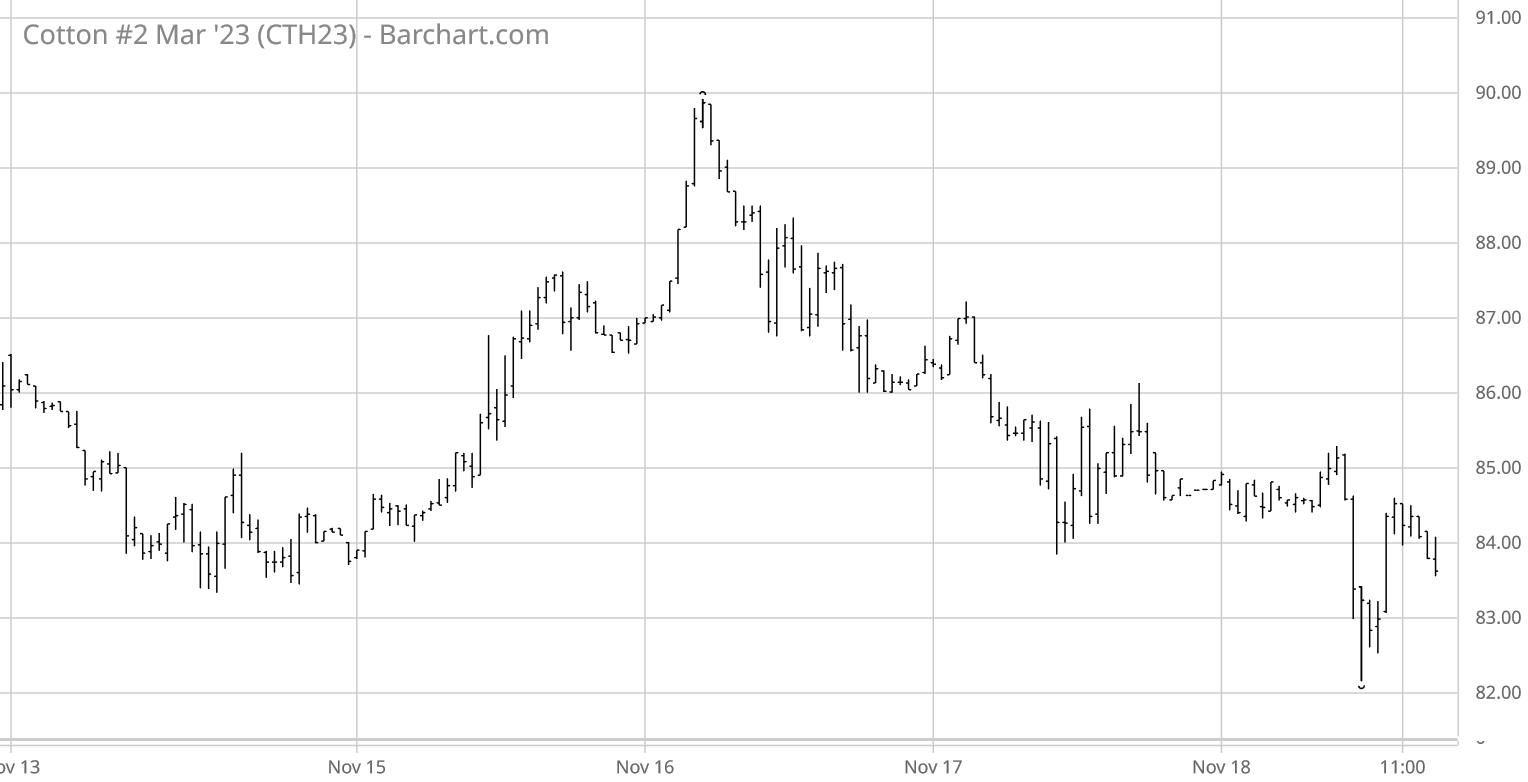
For the week ending Friday, November 18, ICE cotton futures dipped, rallied, and settled back down into what amounted to a big sideways gyration (see chart above courtesy of Barchart.com). On Friday, November 18 the most active Mar’23 contract settled at 83.78 cents per pound, down 1.5 cents on the day and down 2.55 cents from the previous Friday. The Dec’23 settled at 78.96 cents per pound, down 0.60 cents per pound for the week. Chinese cotton prices and the A-Index were mixed/flat across the week.
Cotton-specific influences this week included a continuation of very light-to-moderate demand in inactive/slow physical trading. The pace of weekly export sales weakened while actual export shipments remained sub-par level. U.S. harvest progressed ahead of the historical pace despite widespread to scattered rainfall this week from eastern Texas to the Atlantic seaboard.
ICE cotton futures open interest had a declining pattern this week, while price settlements were mostly mixed. Regularly scheduled fund rolling was responsible for high volume trading. The regular Tuesday snapshot of speculative positioning (through November 15) shows a continued shift away from bearish betting with 1,420 more hedge fund longs and 1,850 fewer hedge fund shorts, week over week. This outweighed the 1,135 cut in index fund long positions this week.
In contrast to ICE cotton, CBOT corn futures had more of an upward stair-step pattern. CBOT soybeans and KC wheat futures both showed more of a gradual downtrend across the week. The U.S. dollar index showed a gyrated sideways patterns that might appear as the bottoming of a six-week slide.
For more details and data on Old Crop and New Crop fundamentals, plus other near term influences, follow these links (or the drop-down menus above) to those sub-pages.
