
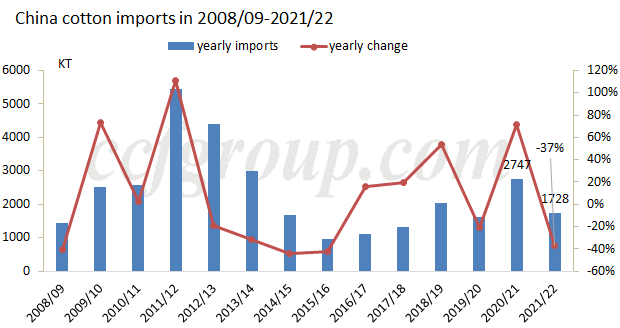
In 2021/22 season (from Sep 2021 to Aug 2022), China imported 1.7282 million tons of cotton, down 37% or 1.02 million tons from 2020/21 season. Import volumes of U.S. cotton were nearly 1 million tons, with a proportion of 58%, to be the largest origin. China exported 28.9kt in 2021/22 season, up 26.4kt year on year. Below is mainly analyzed the 2021/22 China cotton import structure.
In 2021/22 season, China mainly imported U.S. cotton, Brazilian cotton and Africa Franc Zone cotton. Import volumes of U.S. cotton totaled 999.2kt, down 196kt or 16% year on year, that of Brazilian cotton were 450kt, down 37% year on year, and that of cotton from Africa Franc Zone were 102.9kt, down 18% year on year. Imports from other origins were below 100kt. In terms of the unit price, the unit price of cotton from top 5 origins has seen a yearly growth of 35%.

Though the import volumes of U.S. cotton have reduced in 2021/22 compared with 2020/21, but benefited from the political imports, import volumes remained higher than 2019/20 season. However, import volumes of Brazilian cotton was obviously lower than 2019/20 season. The lower imports of Indian cotton were mainly attributed to the large production reduction of Indian cotton in 2021/22 and its high local cotton price.
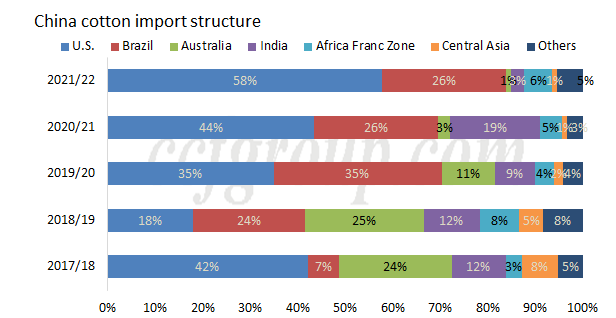
Viewed from the import structure in recent five crop years, the proportion of U.S. cotton in 2021/22 continued to rise to 58%, and that of Brazilian cotton was flat, at 26%. The two totaled 84% of shares.
For the terms of trade, the proportion of ordinary trade increased slightly to 58% in 2021/22, while that of entrepot trade by bonded area and customs warehousing trade reduced somewhat.
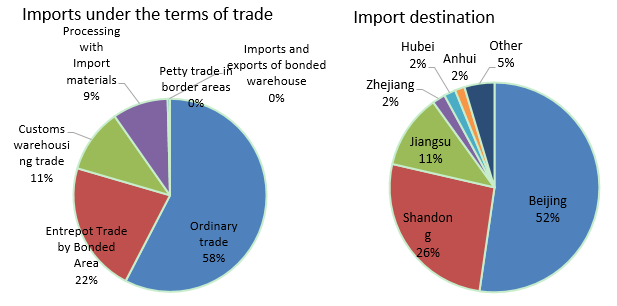
In terms of the destination, enterprises in Beijing, Shandong and Jiangsu imported the most in 2021/22, and imports of Beijing reached 904kt.
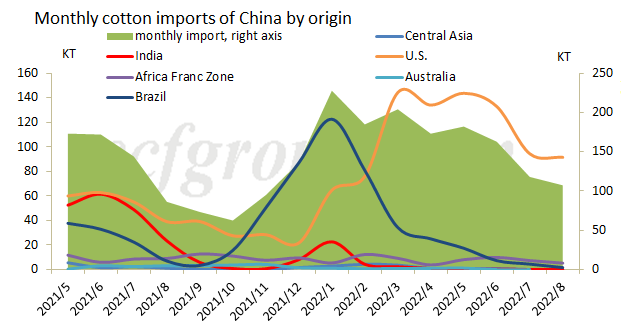
For the monthly imports, after the intensive arrivals in the first quarter of 2022, cotton imports started to reduce, but the reduction was not obvious. From mid-Mar, Chinese cotton prices began to be lower than international cotton, and the price spread has reached above 5,000yuan/mt for long time. Under such condition, the cotton quotas were hard to be used, and only part of export orders used imported cotton. Spinners’ demand for imported cotton reduced. But U.S. cotton imports sustained high and from Mar to Aug, 2022, the shares of U.S. cotton continued to be above 70%, mainly due to the imports under government policy.
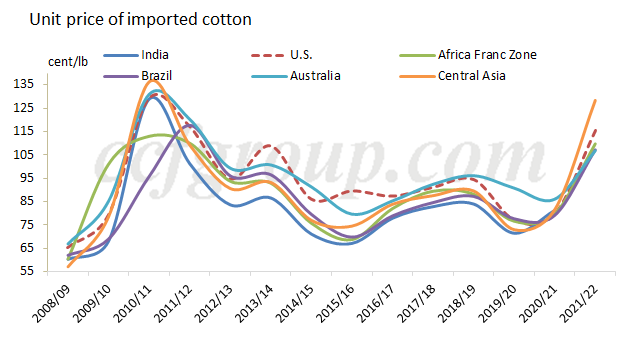
For the unit price, the unit prices of imported cotton rose largely in 2021/22, only slightly lower than the prices in 2010/11 and 2011/12 seasons. The yearly growth of Australian cotton was the lowest, at 24%, and that of Central Asian and Indian cotton was the highest, at 57%.
Conclusion:
In 2021/22 season (from Sep 2021 to Aug 2022), China imported 1.7282 million tons of cotton, down 37% or 1.02 million tons from 2020/21 season. Import volumes of U.S. cotton were nearly 1 million tons, with a proportion of 58%, to be the largest origin. For the imports in 2022/23 season, the import volumes under marketization may continue to reduce year on year as the price spread between Chinese and international cotton is large and may be hard to narrow in short. For the imports under government policy, it is hard to anticipate. Therefore, China cotton imports are likely to reduce further in 2022/23 season.
Πηγή: ccfgroup.com