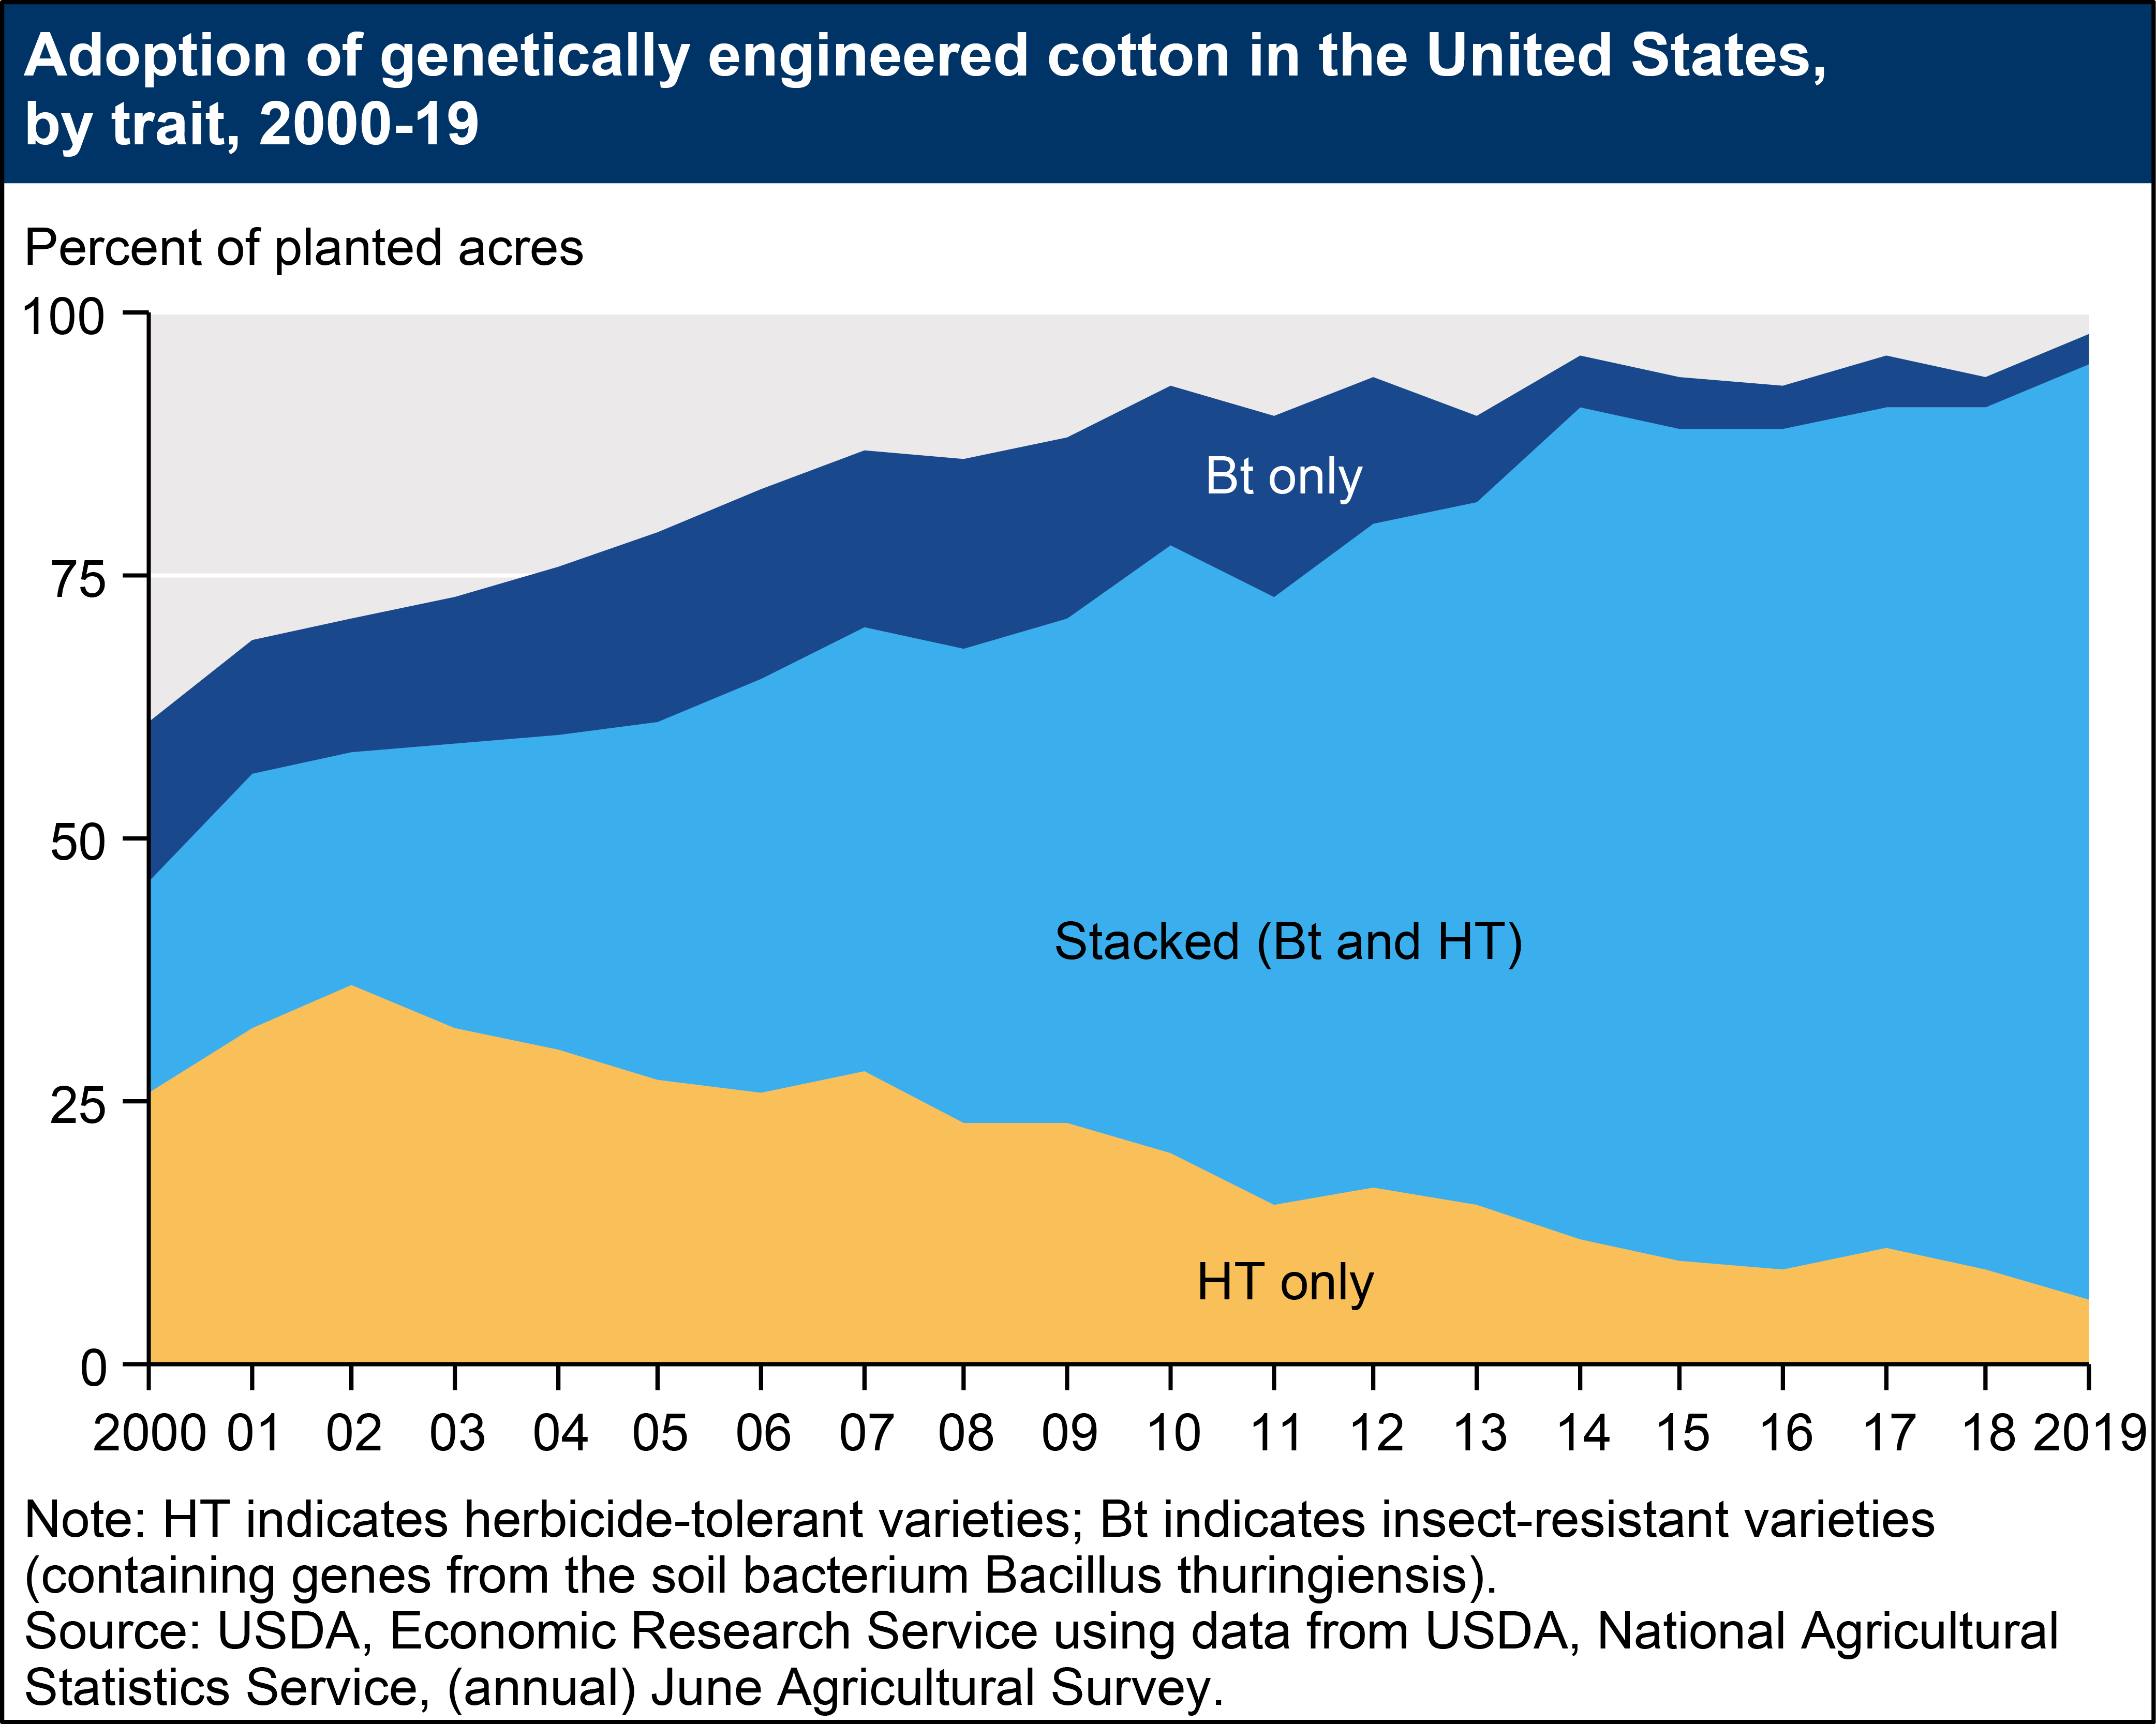
This data product summarizes the adoption of herbicide-tolerant and insect-resistant cotton. The tables below provide data obtained by USDA's National Agricultural Statistics Service (NASS) in the June Agricultural Survey for 2000-19. ERS does not modify the data published in the annual NASS Acreage report.
USDA does not collect or disseminate information about global genetically engineered (GE) seed use. However, the International Service for the Acquisition of Agri-biotech Applications (ISAAA) does produce estimates of global GE acreage, which can be found in their report, Global Status of Commercialized Biotech/GM Crops: 2018.
See more on recent trends in GE adoption, and documentation to the data.
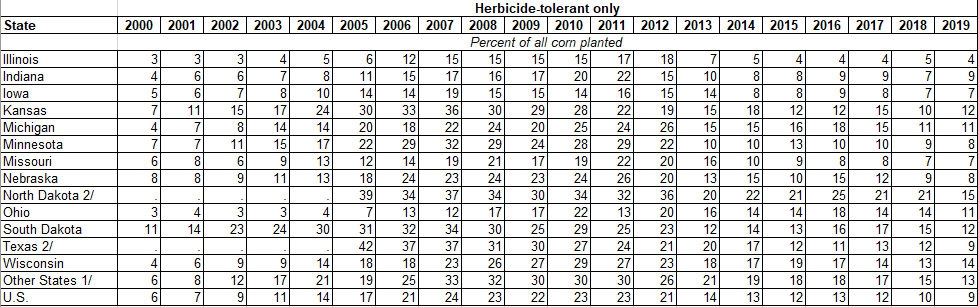
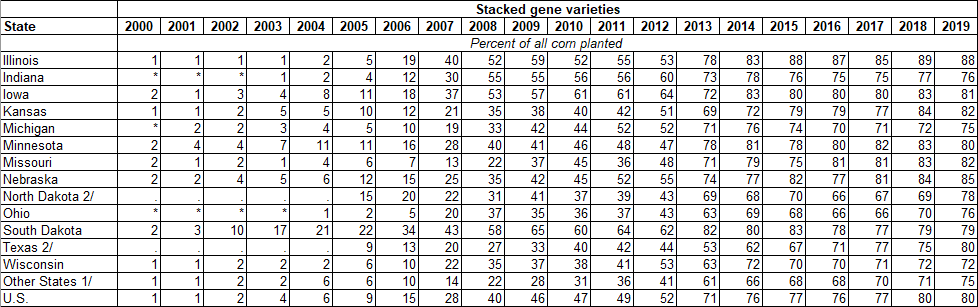
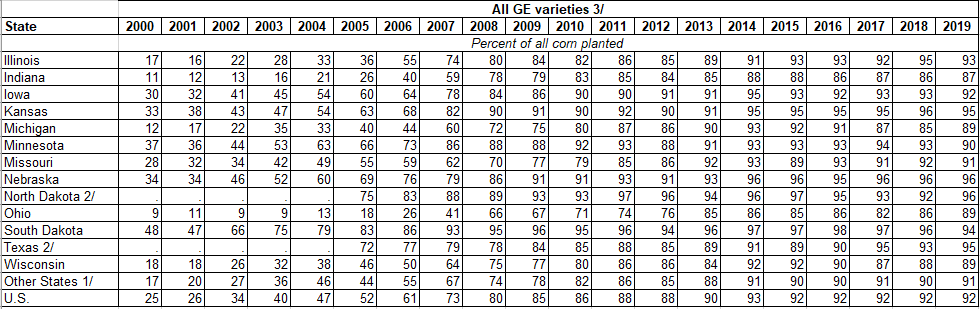
Genetically engineered (GE) upland cotton varieties by State and United States, 2000-19
| Insect-resistant (Bt) only | ||||||||||||||||||||
| State | 2000 | 2001 | 2002 | 2003 | 2004 | 2005 | 2006 | 2007 | 2008 | 2009 | 2010 | 2011 | 2012 | 2013 | 2014 | 2015 | 2016 | 2017 | 2018 | 2019 |
| Percent of upland cotton planted | ||||||||||||||||||||
| Alabama 2/ | . | . | . | . | . | 10 | 10 | 10 | 18 | 13 | 11 | 18 | 17 | 12 | 9 | 4 | 6 | 2 | 1 | 2 |
| Arkansas | 33 | 21 | 27 | 24 | 34 | 42 | 28 | 32 | 30 | 28 | 20 | 18 | 10 | 22 | 13 | 7 | 7 | 7 | 9 | 7 |
| California | 3 | 11 | 6 | 9 | 6 | 8 | 9 | 4 | 7 | 8 | 19 | 9 | 21 | 9 | 15 | 10 | 3 | 2 | 6 | 10 |
| Georgia | 18 | 13 | 8 | 14 | 13 | 29 | 19 | 17 | 19 | 20 | 20 | 18 | 13 | 5 | 3 | 1 | 1 | 4 | 1 | 1 |
| Louisiana | 37 | 30 | 27 | 30 | 26 | 21 | 13 | 17 | 19 | 20 | 19 | 26 | 24 | 19 | 4 | 5 | 10 | 4 | 3 | 3 |
| Mississippi | 29 | 10 | 19 | 15 | 16 | 14 | 7 | 16 | 19 | 14 | 12 | 15 | 9 | 2 | 2 | 1 | 3 | 8 | 2 | 1 |
| Missouri 2/ | . | . | . | . | . | 20 | 32 | 13 | 12 | 18 | 22 | 22 | 33 | 6 | 21 | 6 | 12 | 5 | 6 | 2 |
| North Carolina | 11 | 9 | 14 | 16 | 18 | 17 | 19 | 13 | 19 | 15 | 14 | 10 | 16 | 2 | 3 | 1 | 2 | 3 | 1 | 2 |
| Tennessee 2/ | . | . | . | . | . | 13 | 16 | 10 | 10 | 7 | 8 | 9 | 7 | 4 | 2 | 1 | 1 | 2 | 1 | 1 |
| Texas | 7 | 8 | 7 | 8 | 10 | 14 | 18 | 16 | 16 | 15 | 13 | 18 | 11 | 8 | 4 | 5 | 4 | 5 | 3 | 3 |
| Other States 1/ | 17 | 18 | 19 | 18 | 22 | 18 | 21 | 27 | 22 | 24 | 24 | 21 | 24 | 5 | 3 | 10 | 3 | 3 | 2 | 2 |
| U.S. | 15 | 13 | 13 | 14 | 16 | 18 | 18 | 17 | 18 | 17 | 15 | 17 | 14 | 8 | 5 | 5 | 4 | 5 | 3 | 3 |