Summary
- Trade pushed the fiber higher.
- Cotton prices are a function of global economic growth.
- We are coming into the peak time of the year for prices.
- Levels to watch in the cotton futures market.
- BAL is the cotton ETF product.
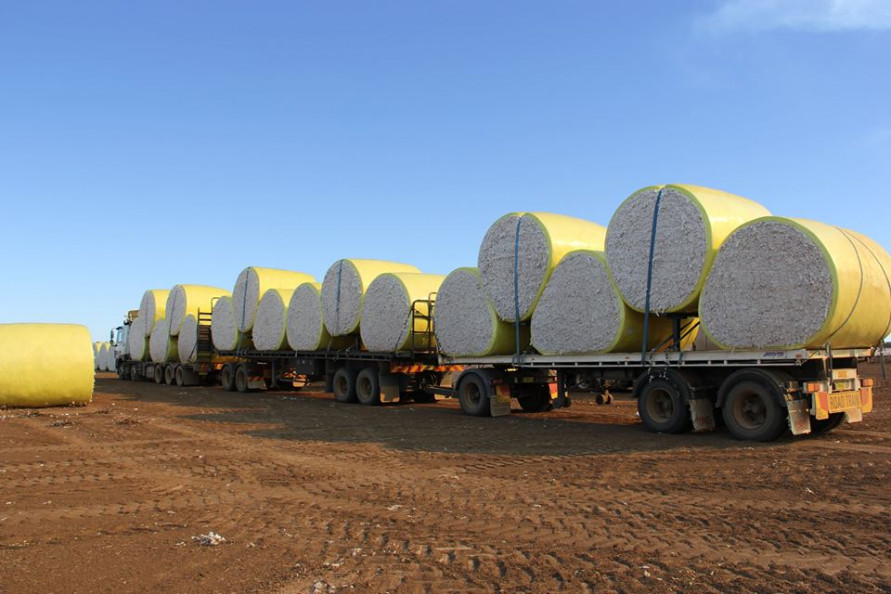
Cotton can be one of the most volatile commodities in the soft commodities sector. The price of cotton exploded to an all-time high at $2.27 per pound in 2011. The rise caused demand to decline dramatically. Clothing manufacturers in China substituted synthetic fibers for cotton because of the high price in 2011. A combination of the sky-high levels of cotton futures and demand destruction led to massive inventories. The price of the soft commodity fell like a stone reaching a low of 55.66 in March 2016. At the peak, there was enough cotton in warehouses in the US and China to make two pairs of jeans for every man, woman, and child on the planet.
Cotton recovered to over 70 cents per pound by the end of 2016. In 2017, the price rose through the 80 cents per pound level. In June 2018, cotton rose to the highest level since 2014 at 96.50 cents.
The trade war between the US and China weighed on the price of the fluffy fiber. Cotton fell to a low of 56.19 cents in August 2019, just 0.53 cents above the 2016 low. Since then, the price has been recovering. The iPath Series B Bloomberg Cotton Subindex Total Return ETN product (BAL) moves higher and lower with the price of cotton futures.
Trade pushed the fiber higher
In early August, US President Trump became frustrated with the progress of trade negotiations and backtracking by the Chinese. To increase pressure on the talks, he slapped new tariffs on China, which led to retaliatory measures from Beijing. The trade war escalated during the summer of 2019. Cotton was one of the agricultural commodities in the crosshairs of the conflict over commerce between the nations with the world's leading GDPs. The price of the fiber dropped to its lowest level since 2016, when it reached 56.19 cents per pound during the week of August 26.
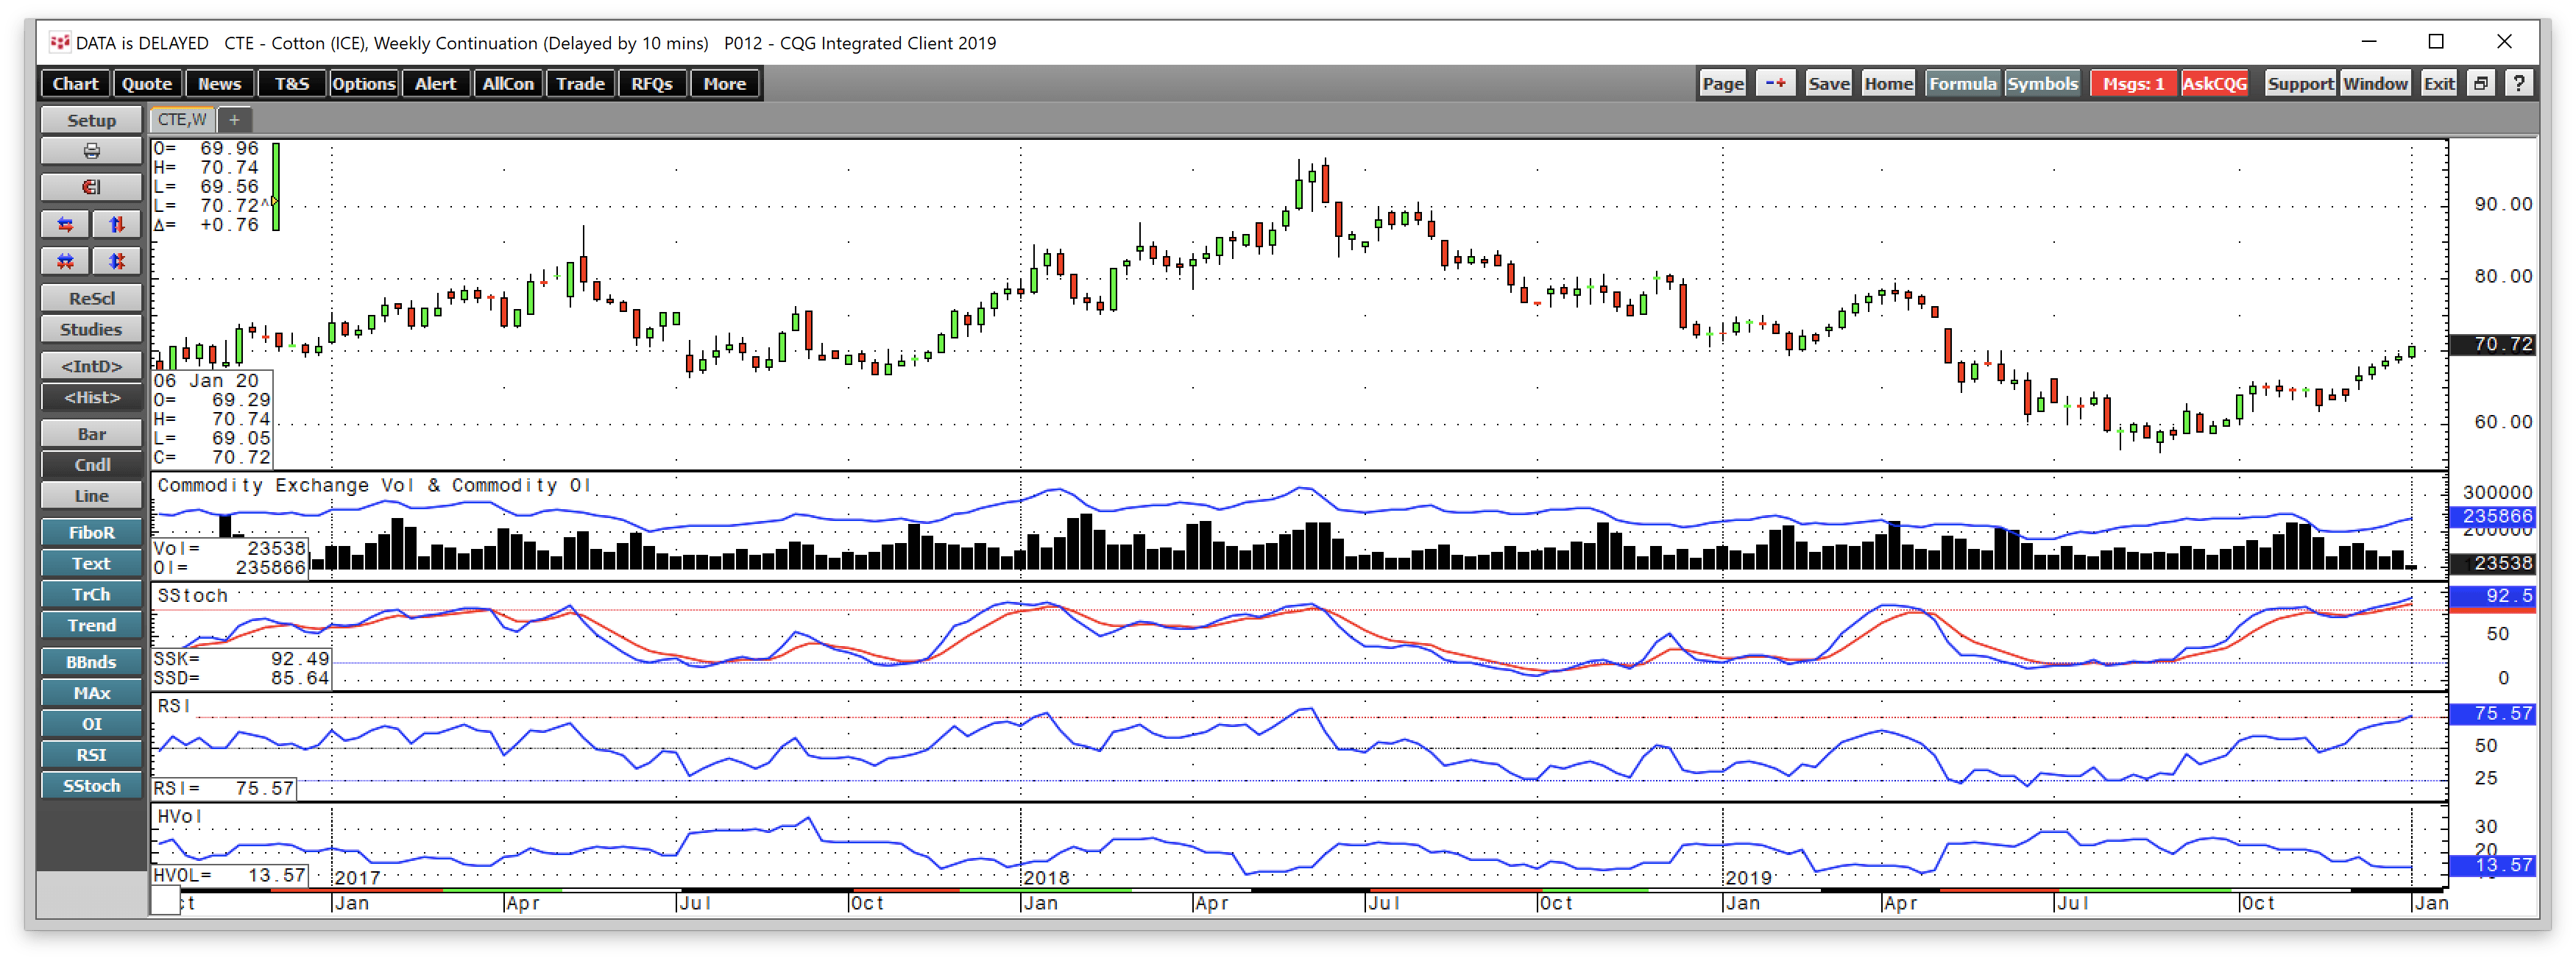
Source: CQG
The weekly chart highlights that cotton hit bottom at a higher low than in 2016 and has been working its way higher over the months that followed. The price of nearby cotton futures straddled 60 cents per pound in September. In October, the fiber futures moved above 65 cents per pound. Cotton future traded north of 65 cents in November and early December. The announcement of the "phase one" trade deal led to a rally that has taken the price higher over the past five consecutive weeks and above 70 cents per pound for the first time since early May 2019.
Price momentum and relative strength indicators have risen into overbought conditions on the weekly chart. The total number of open long and short positions in the cotton futures market increased from 194,863 contracts on December 11, before the announcement of the "phase one" deal. The metric stood at 235,866 contracts on January 9, 21.04% above the December low. At the start of 2020, the price of cotton was higher and flirting with over the 70 cents per pound level, with open interest rising, technical validation of a bullish trend in a futures market.
Cotton prices are a function of global economic growth
A strong economy is supportive of the price of cotton. The more money people have, the more clothing they tend to purchase. At the same time, global demographics have had a bullish long-term impact on the price of cotton.
At the turn of this century, there were around six billion people on our planet.
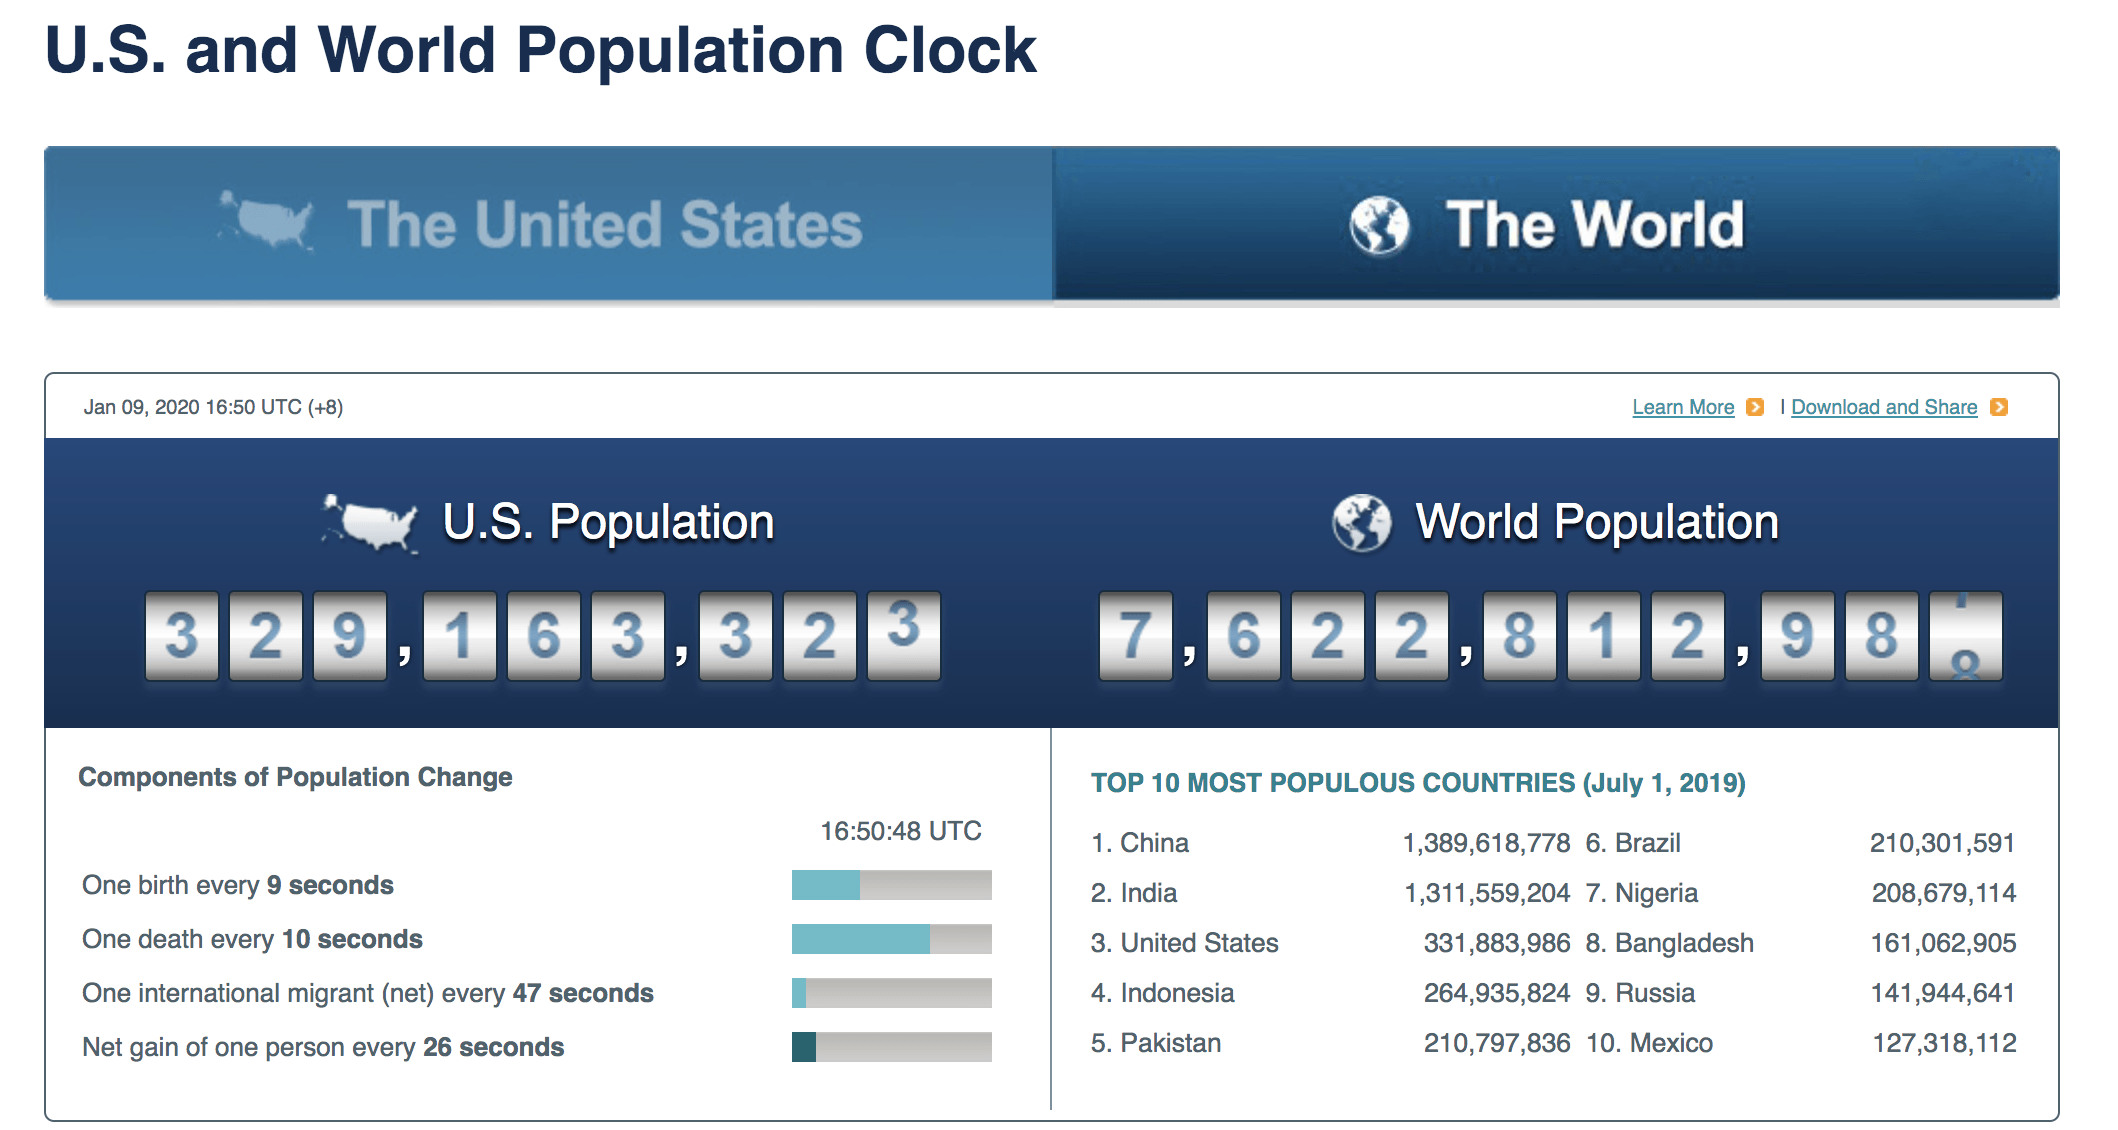
Source: Population Clock
As of January 8, the world's population has grown by over 1.622 billion over the past two decades, an increase of over 27%. The addressable market for clothing and other products that require cotton has grown exponentially. At the same time, wealth increases in China, the world's most populous nation with 1.4 billion people, means that Chinese consumers have more money to spend on clothes and other products made of cotton. The long-term chart reflects the impact of demographics on the price of cotton.
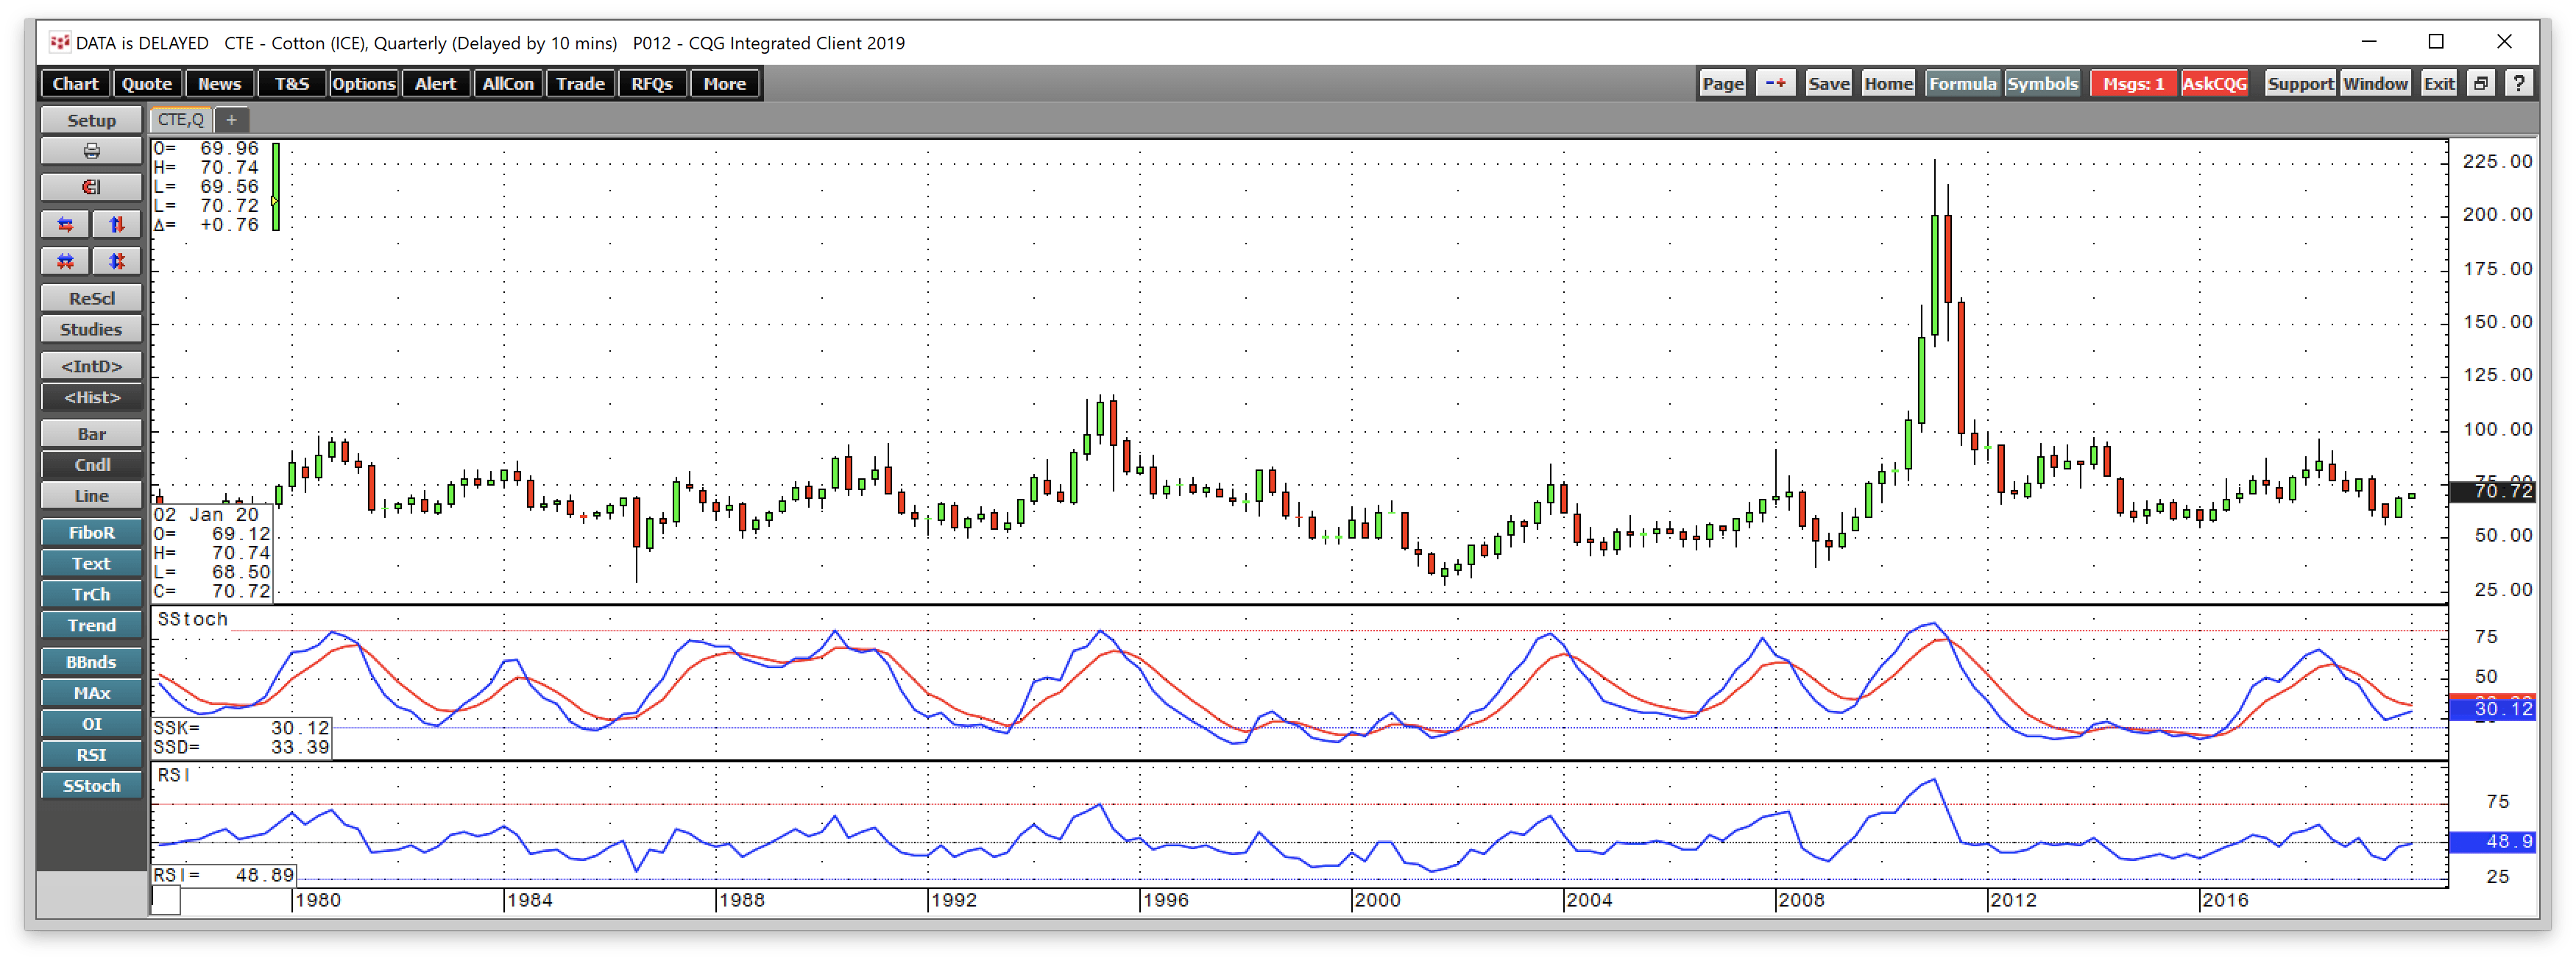
Source: CQG
The quarterly chart illustrates that cotton futures have made higher lows since 2000. The last time the price was below 55 cents per pound was in 2009. Price momentum and relative strength measures were both below neutral readings at the start of 2020, which means there is room for a rally in the cotton market. A de-escalation of the trade war is a factor that is causing the recent price recovery.
We are coming into the peak time of the year for prices
Cotton tends to hit price peaks during the period from March through June each year.

Source: CQG
The chart shows that the all-time high of $2.27 came in March 2011. In 2013, cotton peaked at 93.93 cents in March, and in 2014 the high of 97.35 came during the same month. The May 2017 high was at 87.18, in 2018 the apex came in June at 96.50 cents per pound. Last year, trade prevented any rally during the peak time of the year for prices, but it April 2019, cotton did tick up to just under 80 cents.
With some of the pressure off the trade war, we could see a return to higher prices over the coming months with a peak coming sometime between March and June if history and seasonality repeats.
Levels to watch in the cotton futures market
On the weekly chart, there is a juicy gap between 73.20 and 74.78 per pound.

Source: CQG
Price action tends to fill voids on charts over time, and the gap from April/May 2019 if the first significant bullish target for the cotton futures market. Above there, last year's peak at 79.31 is a technical resistance level. The 80 cents and 90 cents levels will stand as areas of price congestion on the upside. The ultimate target for the cotton futures market stands at the 2018 high of 96.50 cents per pound and the $1 level. Cotton has not moved higher than one dollar per pound since 2011. On the downside, support is at 65, 60, and 56.19 cents per pound.
BAL is the cotton ETF product
At 70.70 cents on the March ICE futures contract and 71.82 cents per pound on the May 2020 contract on January 9, cotton has room to move higher. The most direct route for a risk position in cotton is via the futures and futures options that trade on the Intercontinental Exchange. The iPath Series B Bloomberg Cotton Subindex Total Return ETN product provides an alternative for those that do not venture into the futures arena. The fund summary for BAL states:
The investment seeks return linked to the performance of the Bloomberg Cotton Subindex Total Return. The ETN offers exposure to futures contracts and not direct exposure to the physical commodities. The index is composed of one or more futures contracts on the relevant commodity (the index components) and is intended to reflect the returns that are potentially available through (1) an unleveraged investment in those contracts plus (2) the rate of interest that could be earned on cash collateral invested in specified Treasury Bills.
Source: Yahoo Finance
Cotton can suffer from challenging liquidity at times, so the net assets of BAL at $10.1 million reflect the state of the futures market. An average of 4,407 shares of BAL change hands each day, and the ETN charges an expense ratio of 0.45%. The price of cotton rose from 56.19 in late August 2019 to a high of 70.75 cents per pound on January 9, a rise of 25.9%.
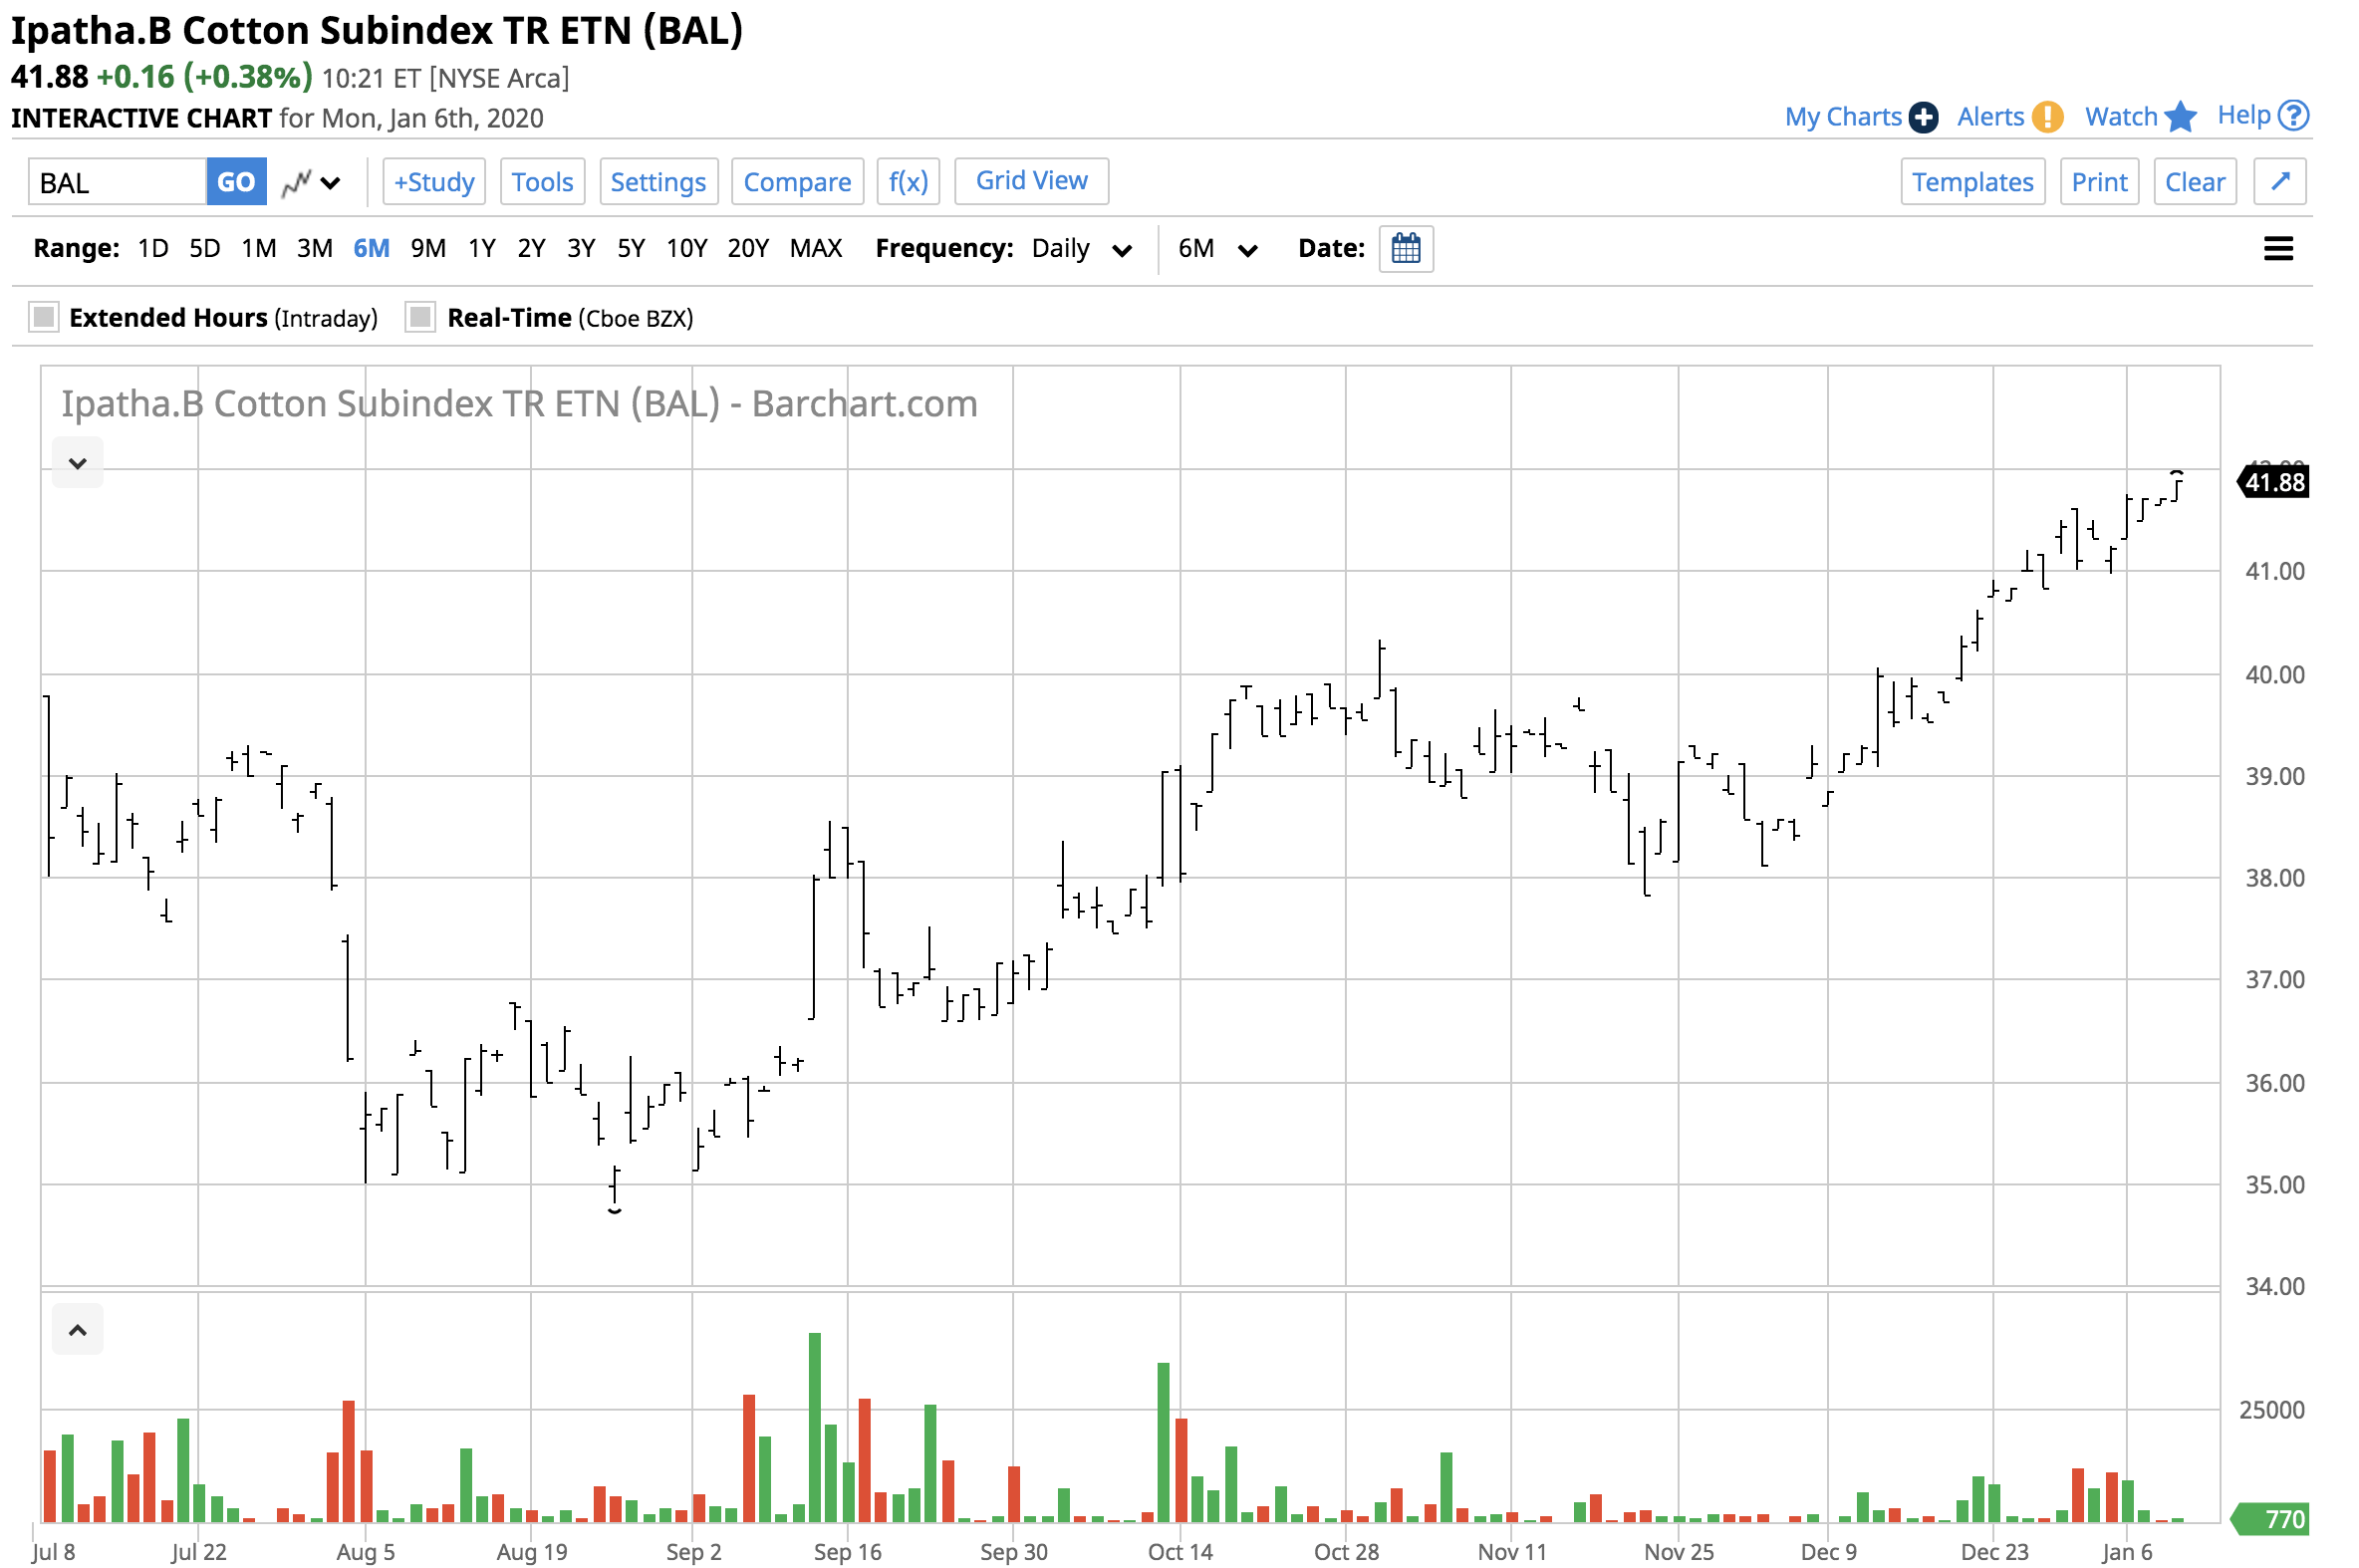
Source: Barchart
As the chart illustrates, the BAL ETN rose from $34.80 to $41.88 per share or 20.3% over the same period. The ETN trailed the price gain in the consecutive ICE futures contract because of the cost of rolling futures from one delivery period to the next in a contango market. Contango is a condition where prices for deferred delivery are higher than nearby periods, which is a cost for those holding and rolling long risk positions.
The trade deal between the US and China is bullish for the cotton market. Seasonality and a void on the chart from last year are compelling reasons to consider a long position in the fluffy fiber.
The Hecht Commodity Report is one of the most comprehensive commodities reports available today from the #2 ranked author in both commodities and precious metals. My weekly report covers the market movements of 20 different commodities and provides bullish, bearish and neutral calls; directional trading recommendations, and actionable ideas for traders. I just reworked the report to make it very actionable!
Disclosure: I/we have no positions in any stocks mentioned, and no plans to initiate any positions within the next 72 hours. I wrote this article myself, and it expresses my own opinions. I am not receiving compensation for it (other than from Seeking Alpha). I have no business relationship with any company whose stock is mentioned in this article.
Additional disclosure: The author always has positions in commodities markets in futures, options, ETF/ETN products, and commodity equities. These long and short positions tend to change on an intraday basis.
