Summary
Bear market action since 2011.
A spectacular July rally.
Post WASDE selling.
Inventories are crucial.
63 cents is a line in the sand.
Cotton was a superstar in 2011 when the price traded to an all-time high of $2.27 per pound. Before those dazzling highs, futures contracts on the fiber never traded above $1.1720. In the world of commodities, anything is possible. In 2001, cotton futures traded below 30 cents and in 2008 they hit lows of under 40 cents. The 2011 rally was unbelievable, and when the price eclipsed all-time highs and kept going, many experienced commodity traders fought the rally and several lost everything, even the cotton shirts on their backs.
When a supply shortage occurs in an agricultural commodity, scarcity forces many to pay any price to secure a raw material. As industrial users were paying up for their requirements, those who went short the fiber had to cover positions as cotton looked like there was no upside limit to the price. Those shorts thought the price of cotton had reached a level where consumers would turn to other synthetic fibers, and they were correct. The largest consumer in the world, China, began to eliminate cotton from manufacturing because of the high price.
Meanwhile, trend-following speculators rode the cotton bull like championship bull riders at a rodeo. Then, as often happens, in March of 2011 on a final blow-off high to $2.27 the price turned, and those with long positions who were riding the bullish trend became the big losers if they hesitated to book profits when the price of cotton fell like a stone.
Bear market action since 2011
A picture is often worth a thousand words and the monthly cotton chart shows the ugly price action that occurred after March 2011.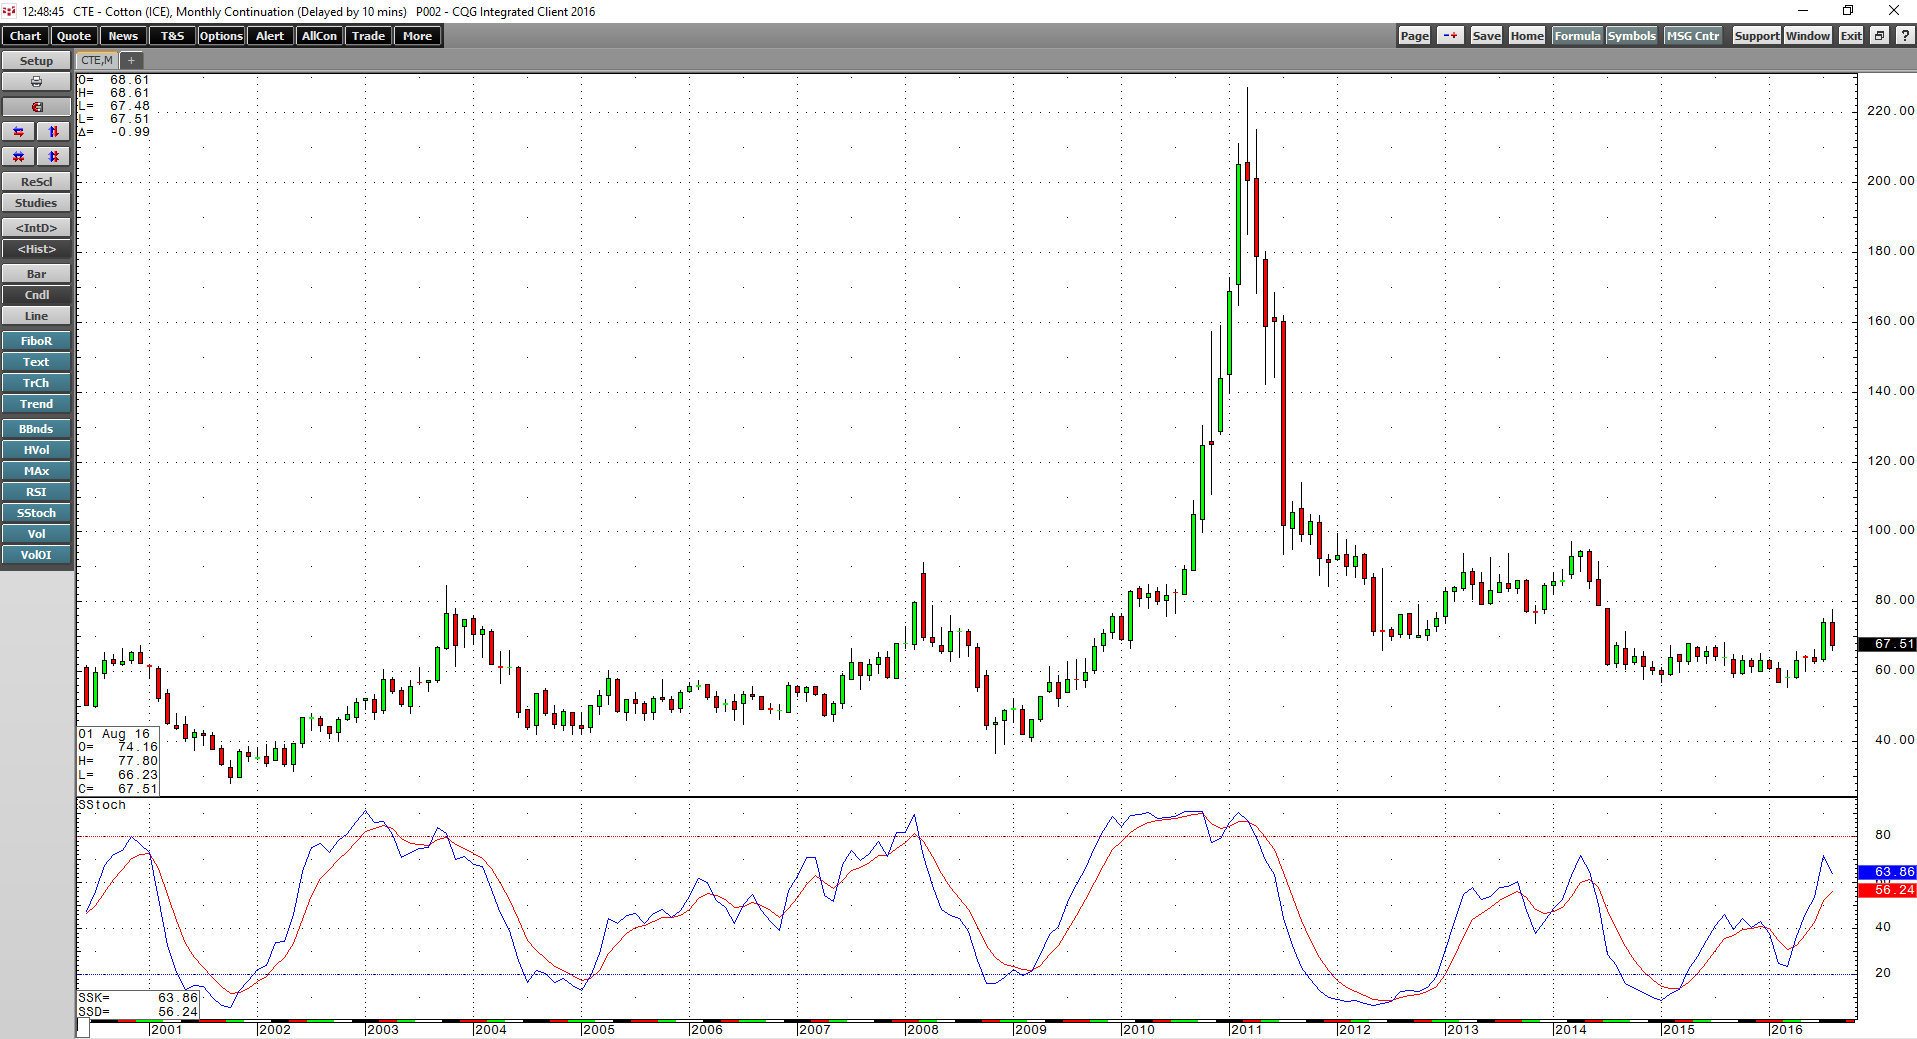 By July of 2011, the price of cotton futures was back below $1 per pound, and they began a descent that took them to lows of 55.66 cents in March 2016. The reason for the five-year bear market in the fiber was that high prices caused dramatic production increases from the world's top producers including China, India, the United States, Pakistan, Brazil, Uzbekistan and Australia. As output increased, inventories grew, and the price continued to move lower. Cotton did not trade above 70 cents per pound between October 2014 and June 2016 as stockpiles weighed heavily on price. At one point last year, there was enough cotton in storage to produce several pairs of jeans for every man, woman and child on earth.
A spectacular July rally
After five years of horrible trading conditions in the cotton futures market, the price finally showed signs of life in July.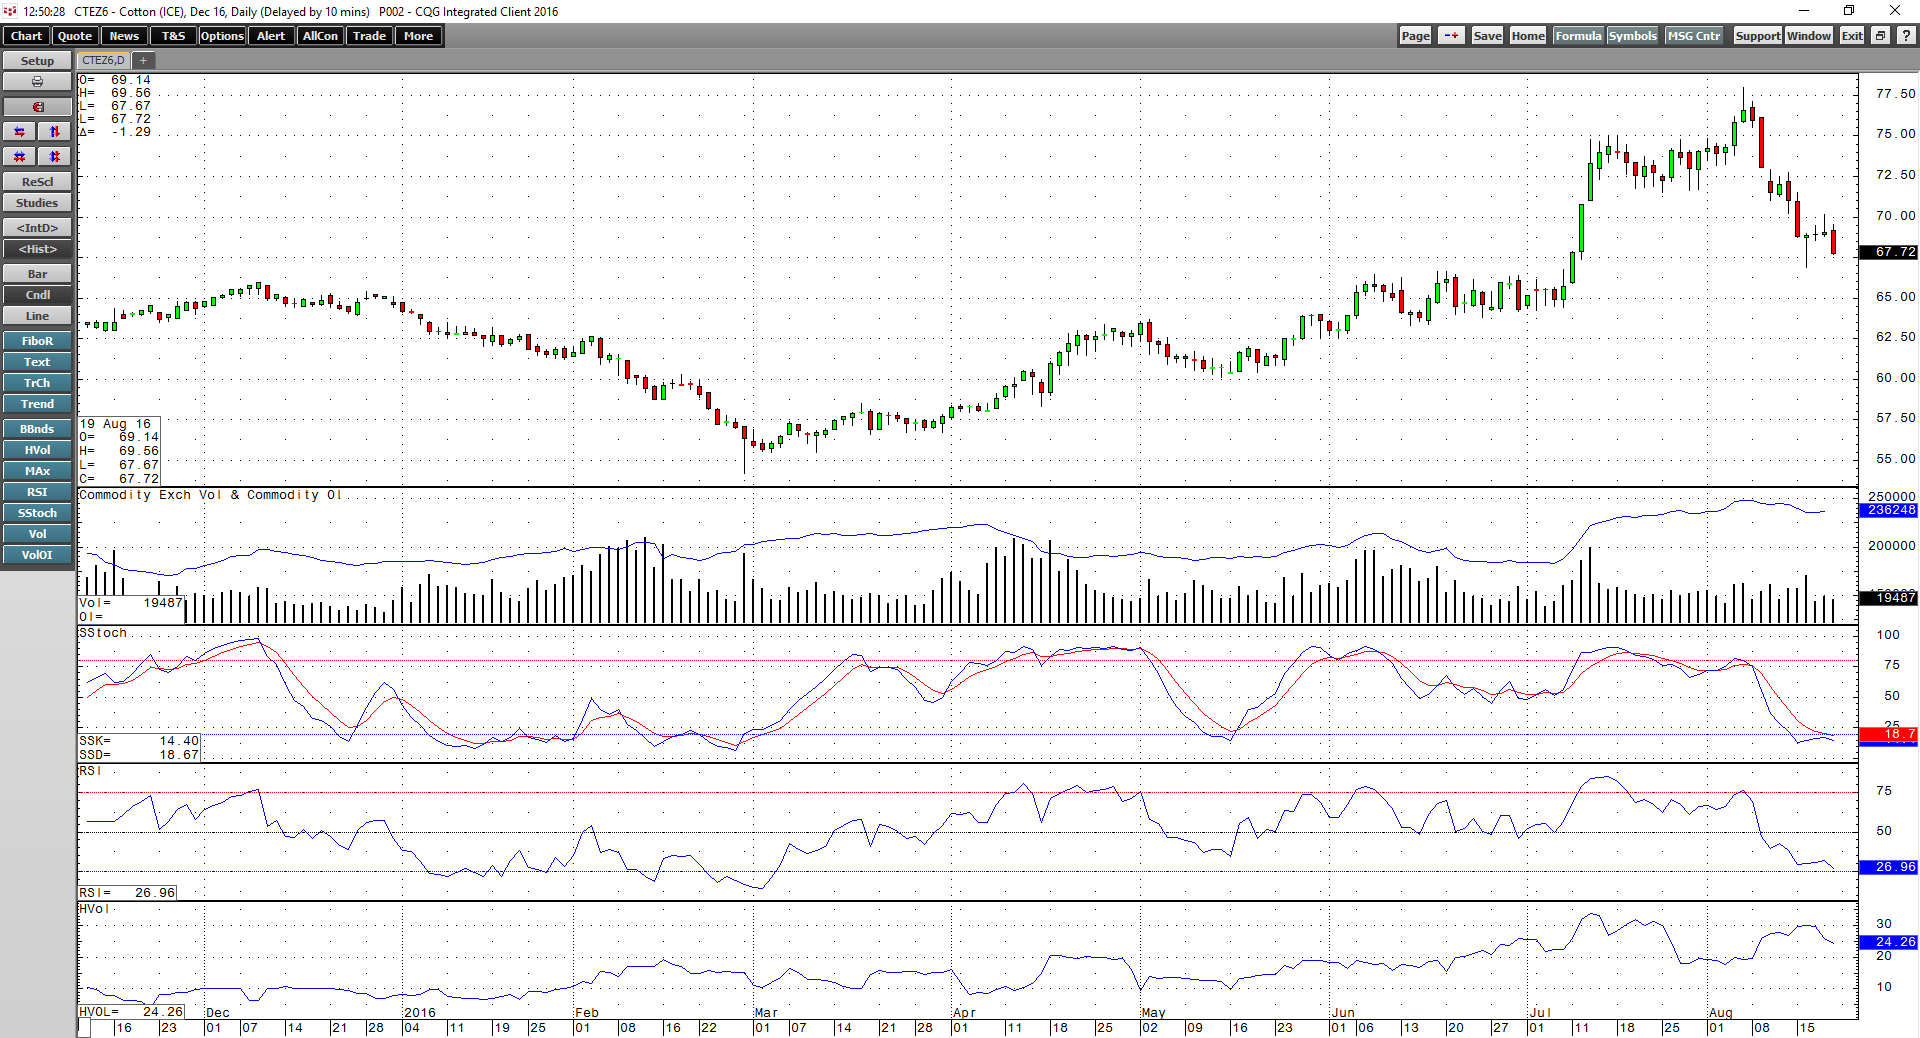 As the daily cotton chart illustrates, the price moved above resistance at 66.64 cents per pound on July 11 and took out the 70 cent level the next day. December ICE cotton futures rose to highs of 77.98 cents on August 5 when the prospects of an upcoming USDA's World Agricultural Supply and Demand Estimates report loomed largely. Cotton fell to around 71 cents before the August report that highlights inventory numbers and production levels for the fiber at the end of growing season.
The WASDE told traders that there would be a slight increase in production and ending stocks compared with the July report and the price of cotton continued to fall, reaching lows of 66.88 cents last week. The lows were just 0.24 cents above the level from which it broke out to the upside, and that resistance has now become critical support for the fiber. Cotton closed last week at below the 68 cents per pound level. The daily chart offers some valuable information about the technical state of the fiber at this juncture.
The price swoon of over 14% from the August 5 highs to the August 16 lows caused the slow stochastic, a momentum indicator, to fall in to oversold territory on the daily chart. The relative strength index also displays that same condition. Open interest, the total number of open long and short positions has remained steady at over the 236,000 contract level, which is the highest open interest since October 2010.
Post WASDE selling
Since 2011, speculators and traders have become accustomed to low cotton prices compared to the dizzying heights of five years ago. Perhaps that is why the price continued to decline after the August WASDE in the face of only a slight increase in production and inventories. However, the price seems to have found a bottom that is above the July breakout level, and that could be good news for the longs that remain in the cotton market.
The open interest began to rise in July, and while there has been a slight decline from highs of over 248,000 contracts, many speculative longs remain in positions as of last Friday. Steady open interest could be good or bad news for cotton moving forward. The fact that buyers are resilient is a positive sign for the fiber, but if those longs turn sellers over coming sessions, we could see the price fall below the support level at around 66.50 cents. I believe that we could see a reduction of open interest that may take the price lower to test the support and perhaps below. However, the crucial level for me is 63 cents, the bottom end of the trading range from June. If cotton can hold those lows, we will likely see another test of the highs and perhaps a new high in the weeks ahead. Cotton is a very volatile commodity, and inventories have been a weight around the fiber's neck for years.
Inventories are crucial
The WASDE told us that projected world ending stocks are 2% lower because of a combination of lower beginning stocks and a decline in production. The USDA reduced beginning stockpiles by 1.1 million bales because of revisions in China, India and Australia. World ending stocks moved lower by a total of 1.7 million bales to 89.6 million. Inventories are what put a cap on the price of cotton over recent years, and they will be the deciding factor for the path of least resistance for prices going forward. However, cotton has corrected lower, and if open interest can hold up over the weeks ahead, it is likely that the price will begin to edge higher once again as the September WASDE report could yield more stockpile reductions when it comes to global supplies.
One thing that cotton has going for it is that there is no roll coming anytime soon, the active month futures contract is the December contract, and that means that market participants will not need to move their risk forward for at least another three months.
63 cents is a line in the sand
The first line of defense for long positions in cotton is at the 66.64 level, below there 63 cents is a line in the sand for the future of the fiber. The move in July was significant for cotton, which tends to be an incredibly volatile commodity when it decides to run.
I believe that cotton is currently at a price where risk-reward favors long positions. One should place stops below 63 cents, and the profit target on a long position at 69 cents is between the 80-90 cent levels. At 85 cents, this sets up a better than 2:1 reward to risk ratio for purchases at 68 cents. For those who do not trade in the cotton futures market, the iPath Bloomberg Cotton Subindex Total Return ETN (SYMBOL: BAL) offers a way to position in cotton without trading in the futures markets.
Cotton has dropped to a level which is once again attractive for a limited risk long position. The critical level of technical support will be at 63 cents, and I'm a scale down buyer to that level. At the current risk-reward level, you will not have to risk your cotton shirt for potential profits in this commodity that can trade in very volatile fashion.
I have introduced a new weekly service through Seeking Alpha Marketplace. Each Wednesday I will provide subscribers with a detailed report on the major commodity sectors covering over 30 individual commodity markets, most of which trade on U.S. futures markets. The report will give an up, down or neutral call on these markets for the coming week and will outline the technical and fundamental state of each market. At times, I will make recommendations for risk positions in the ETF and ETN markets as well as in commodity equities and related options. You can sign up for The Hecht Commodity Report on the Seeking Alpha Marketplace page.
