*This is the next article in our 2026 Southwest Economic Outlook series. Economists from Texas A&M University and Texas A&M AgriLife Extension, and Oklahoma State University and Oklahoma State University Extension provide a 2026 outlook on various topics and commodities. A digital copy of the Economic Outlook Issue is also available online.
The outlook for U.S. cotton is, as always, uncertain. This article highlights some of the more notable sources of risk for either lower or higher prices during 2026.
One indicator of 2026 supply and demand expectations is the futures market itself. Intercontinental Exchange (ICE) December 2026 cotton futures have generally traded in the upper-60s range throughout 2025, at a several-cent premium to December 2025. That suggests that traders expect somewhat similar supply and demand conditions year over year.
Early indicators of supply reinforce this expectation, beginning with the question of U.S. cotton acreage in 2026.
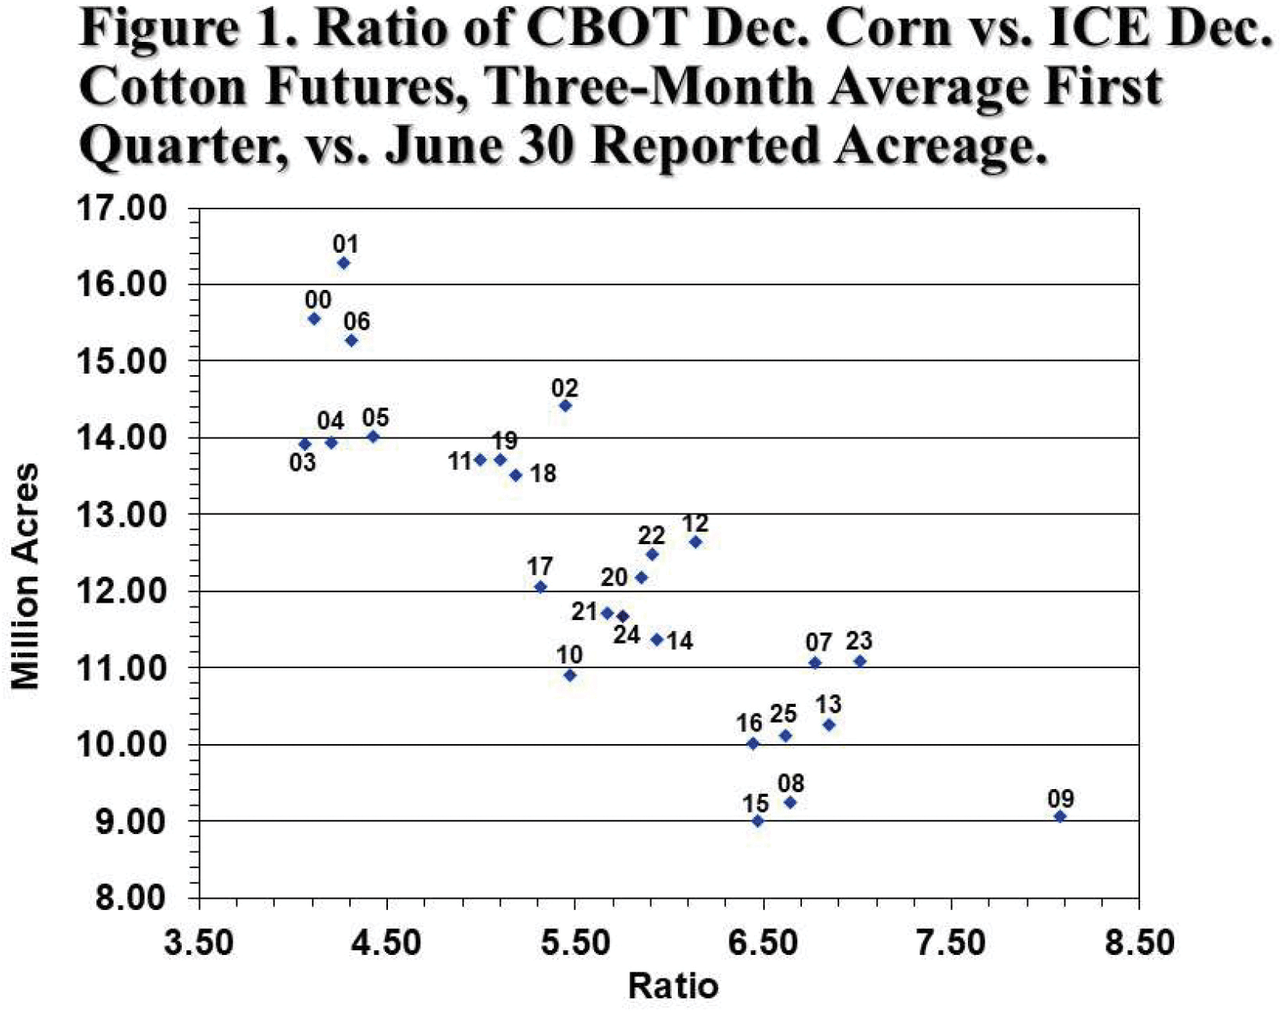
One major influence on U.S. cotton plantings is relative prices of alternative crops. For example, U.S. cotton acreage varies inversely with the ratio of December 2026 Chicago Board of Trade corn futures to December 2026 ICE cotton futures in the first quarter of the year (Figure 1). Based on the most recent levels of that price ratio, we might expect around 10 million acres of U.S. Upland and Pima combined. That represents little change over what U.S. growers planted in 2025, although the distribution might vary with more planted in the eastern Cotton Belt and more in Kansas, Oklahoma and Texas.
Other factors could reinforce cotton planting. Many regions of the country saw strong yields in 2025, which may keep some growers planting cotton. If La Niña dryness extends into early-planting season, that could lead to an expansion of cotton plantings in Texas, a common phenomenon. Above-average plantings could get balanced out by above-average abandonment.
On the other hand, a few timely rain events between planting dryness and August heat could muddy up the picture considerably. Either way, it is a set up for classic weather market uncertainty until the U.S. supply/demand picture is clarified next fall.
International picture
Meanwhile, the cotton world stocks-to-use ratio excluding China is approximately 50%. This metric suggests that supply is solid and mills currently have enough coverage. This inventory comfort will likely keep prices relatively constant unless global consumer demand shifts dramatically in the coming months.
Regarding demand, positive expectations are currently poor. One of the key indicators that drives demand is global economic growth. For 2025, the World Bank forecast a decrease of 2.3%. For 2026 and 2027, growth projections are only slightly higher. The main causes of low growth are trade restrictions and policy uncertainty, which translates directly to cautious consumer spending on apparel.
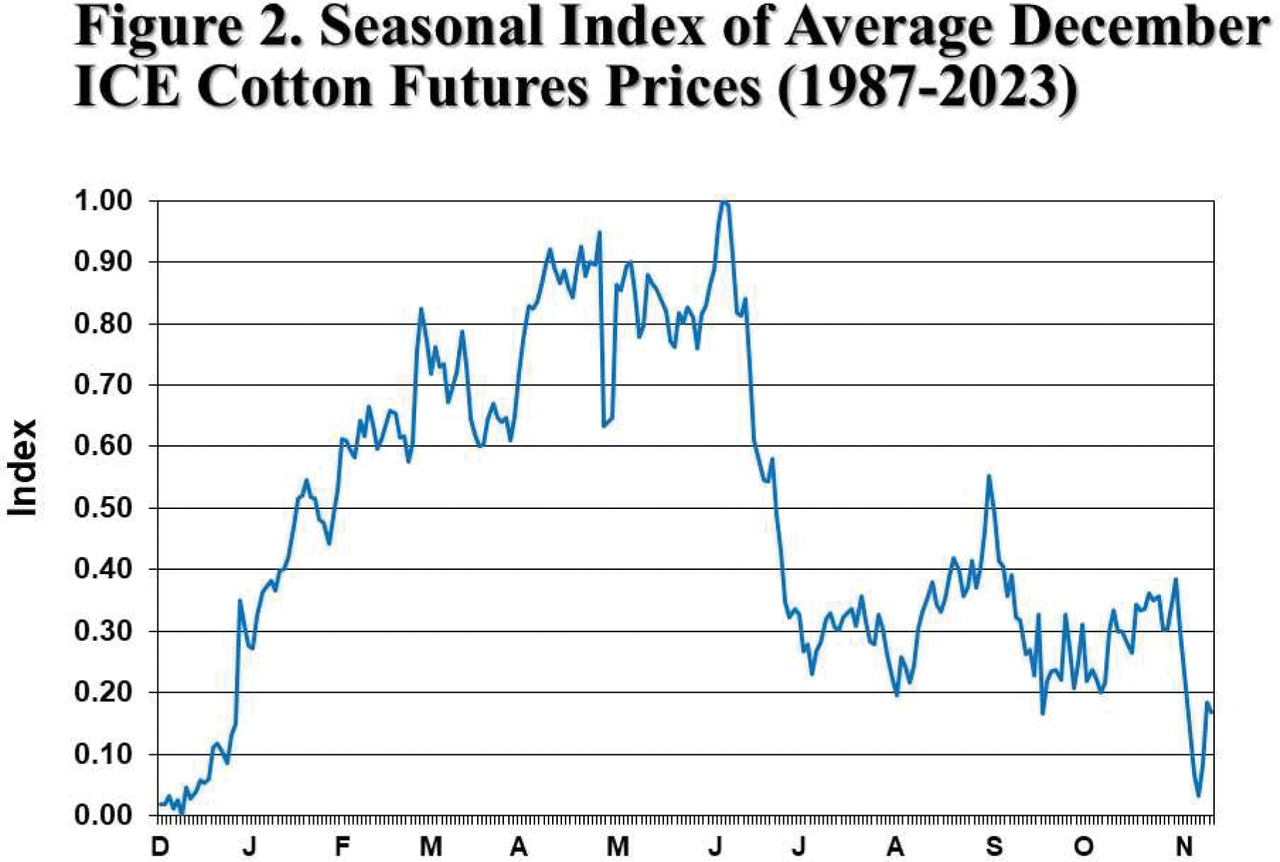
So where does that leave the price outlook? On average, the harvesttime ICE December contract rises during the first half of the year and downshifts in the second (Figure 2). Following the historical pattern, December 2026 ICE cotton could make a run at the mid- to upper 70s, especially with low plantings and high abandonment.
However, such weather market volatility does not, on average, tend to last into harvesttime (Figure 2), even less so if demand does not strengthen.
