Andrew Hecht, Commodities, long/short equity, medium-term horizon, long-term horizon
Summary
Cotton fell to the lowest price since 2016.
A period of consolidation followed.
The trade war weighed on the price of the fiber.
"Phase one" of a deal is bullish for cotton.
BAL is the cotton ETF - levels to watch in the cotton futures market.
Looking for more stock ideas like this one? Get them exclusively at Hecht Commodity Report. Get started today »
Cotton is a member of the soft commodities sector of the raw materials asset class. The agricultural commodity is a primary ingredient in clothing, bedding, and many other products we use each day. The US has a long history as a cotton producer. "King Cotton" was a phrase used by Southern politicians to explain economic independence after succession from the union in the mid-1800s. In India, Gandhi used cotton for political purposes. In 1920, he launched a boycott of British cotton goods and urged Indians to wear only homespun clothing. Cotton became a symbol of Indian independence from the colonial British.
Meanwhile, it is no surprise that cotton has been one of the commodities caught on the front lines of the trade war between the US and China. The price sunk as US exporters lost a critical market. The iPath Series B Bloomberg Cotton Subindex Total Return ETN product (BAL) replicates the price action in the cotton futures market on the Intercontinental Exchange. Liquidity has been building in the ETN. The price of cotton fell to a level where it was at the bottom end of its pricing cycle.
Cotton fell to the lowest price since 2016
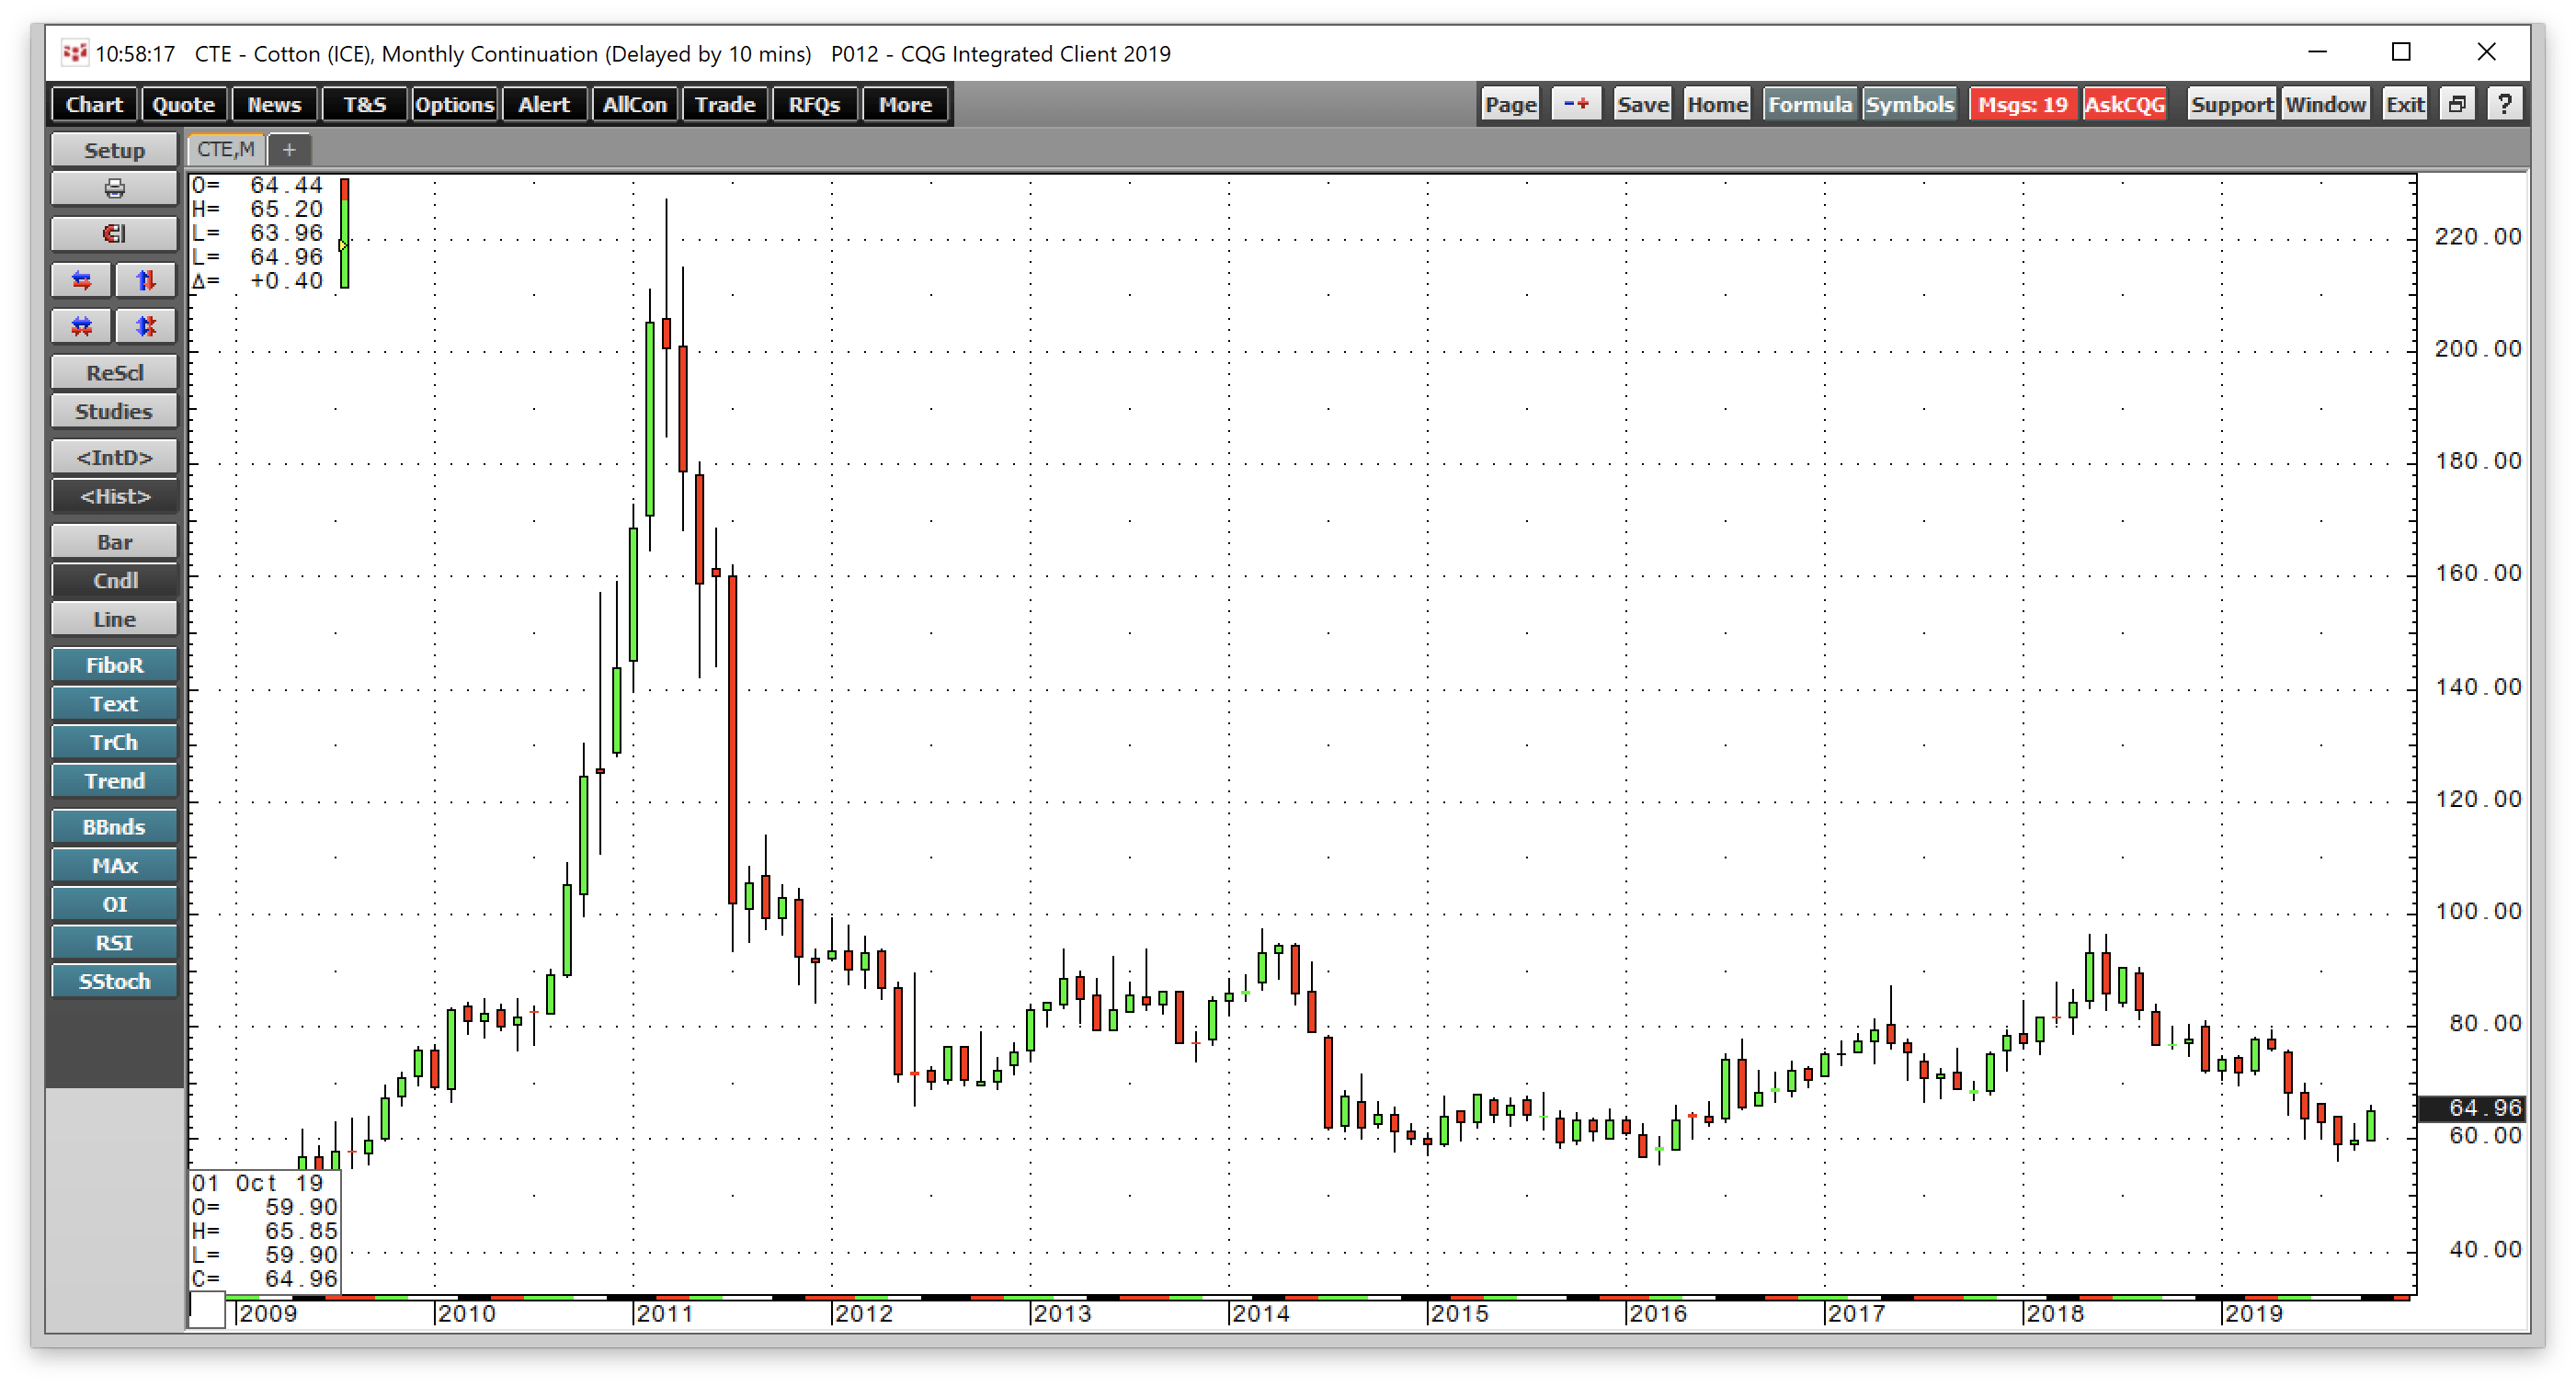
After trading to an all-time high at $2.27 per pound in March 2011, an oversupply of cotton led to price carnage that took the price to lows of 55.66 five years later in March 2016. The oversupply of cotton rose to a level where there was enough of the fiber in stockpiles in the US and China to produce two pairs of jeans for every man, woman, and child on the planet.
The decline to under 56 cents caused production to slow, inventories to decline, and the price to rise.
Source: Barchart
The chart highlights the recovery in the cotton futures market that took the price from the March 2016 low back to a high at 96.50 cents per pound in June 2018. Cotton futures ran out of upside steam as they approached the $1 per pound level. By August 2019, the price slipped back to a low at 56.19 cents, just 0.53 cents above the March 2016 bottom in the fluffy fiber.
A period of consolidation followed
While the nearby futures contract fell to 56.19 cents, the active month December contract on the Intercontinental Exchange found a low at 56.59 cents. Since then, the price has been climbing and consolidating.
Source: CQG
The daily chart shows that cotton futures have been making higher lows and higher highs since August. The most recent peak came on October 14 at 65.85 cents. On Tuesday, October 22, the price of December cotton future was at just below 65.16 cents per pound.
Open interest, the total number of open long and short positions in the cotton futures market, has been climbing with the price. When the metric rises with the price, it is typically a technical validation of an emerging bullish trend in a futures market. Price momentum and relative strength indicators are rising into overbought territory on the short-term chart. Daily price volatility has increased from under 10% in early October to the 30% level as of October 22. Cotton is rising, and the price is consolidating after the fall to a higher long-term low in August.
The trade war weighed on the price of the fiber
The trade war between the US and China has been bearish for the cotton futures market. China and the US are substantial producers of the fiber, and China is one of the world's leading consumers. Since US farmers depend on exports, tariffs and retaliatory measures have caused the loss of a critical addressable market for cotton. The fiber has been one of the agricultural products caught in the crosshairs of the trade war since 2018.
The early August push to the lowest price since 2016, came in the aftermath of an escalation in the trade war. On August 1, US President Trump slapped new tariffs on China after he became frustrated with the pace of negotiations and Chinese backtracking on some of the critical issues. Cotton fell to a low in August because it was a victim of the ongoing wave of protectionist policies.
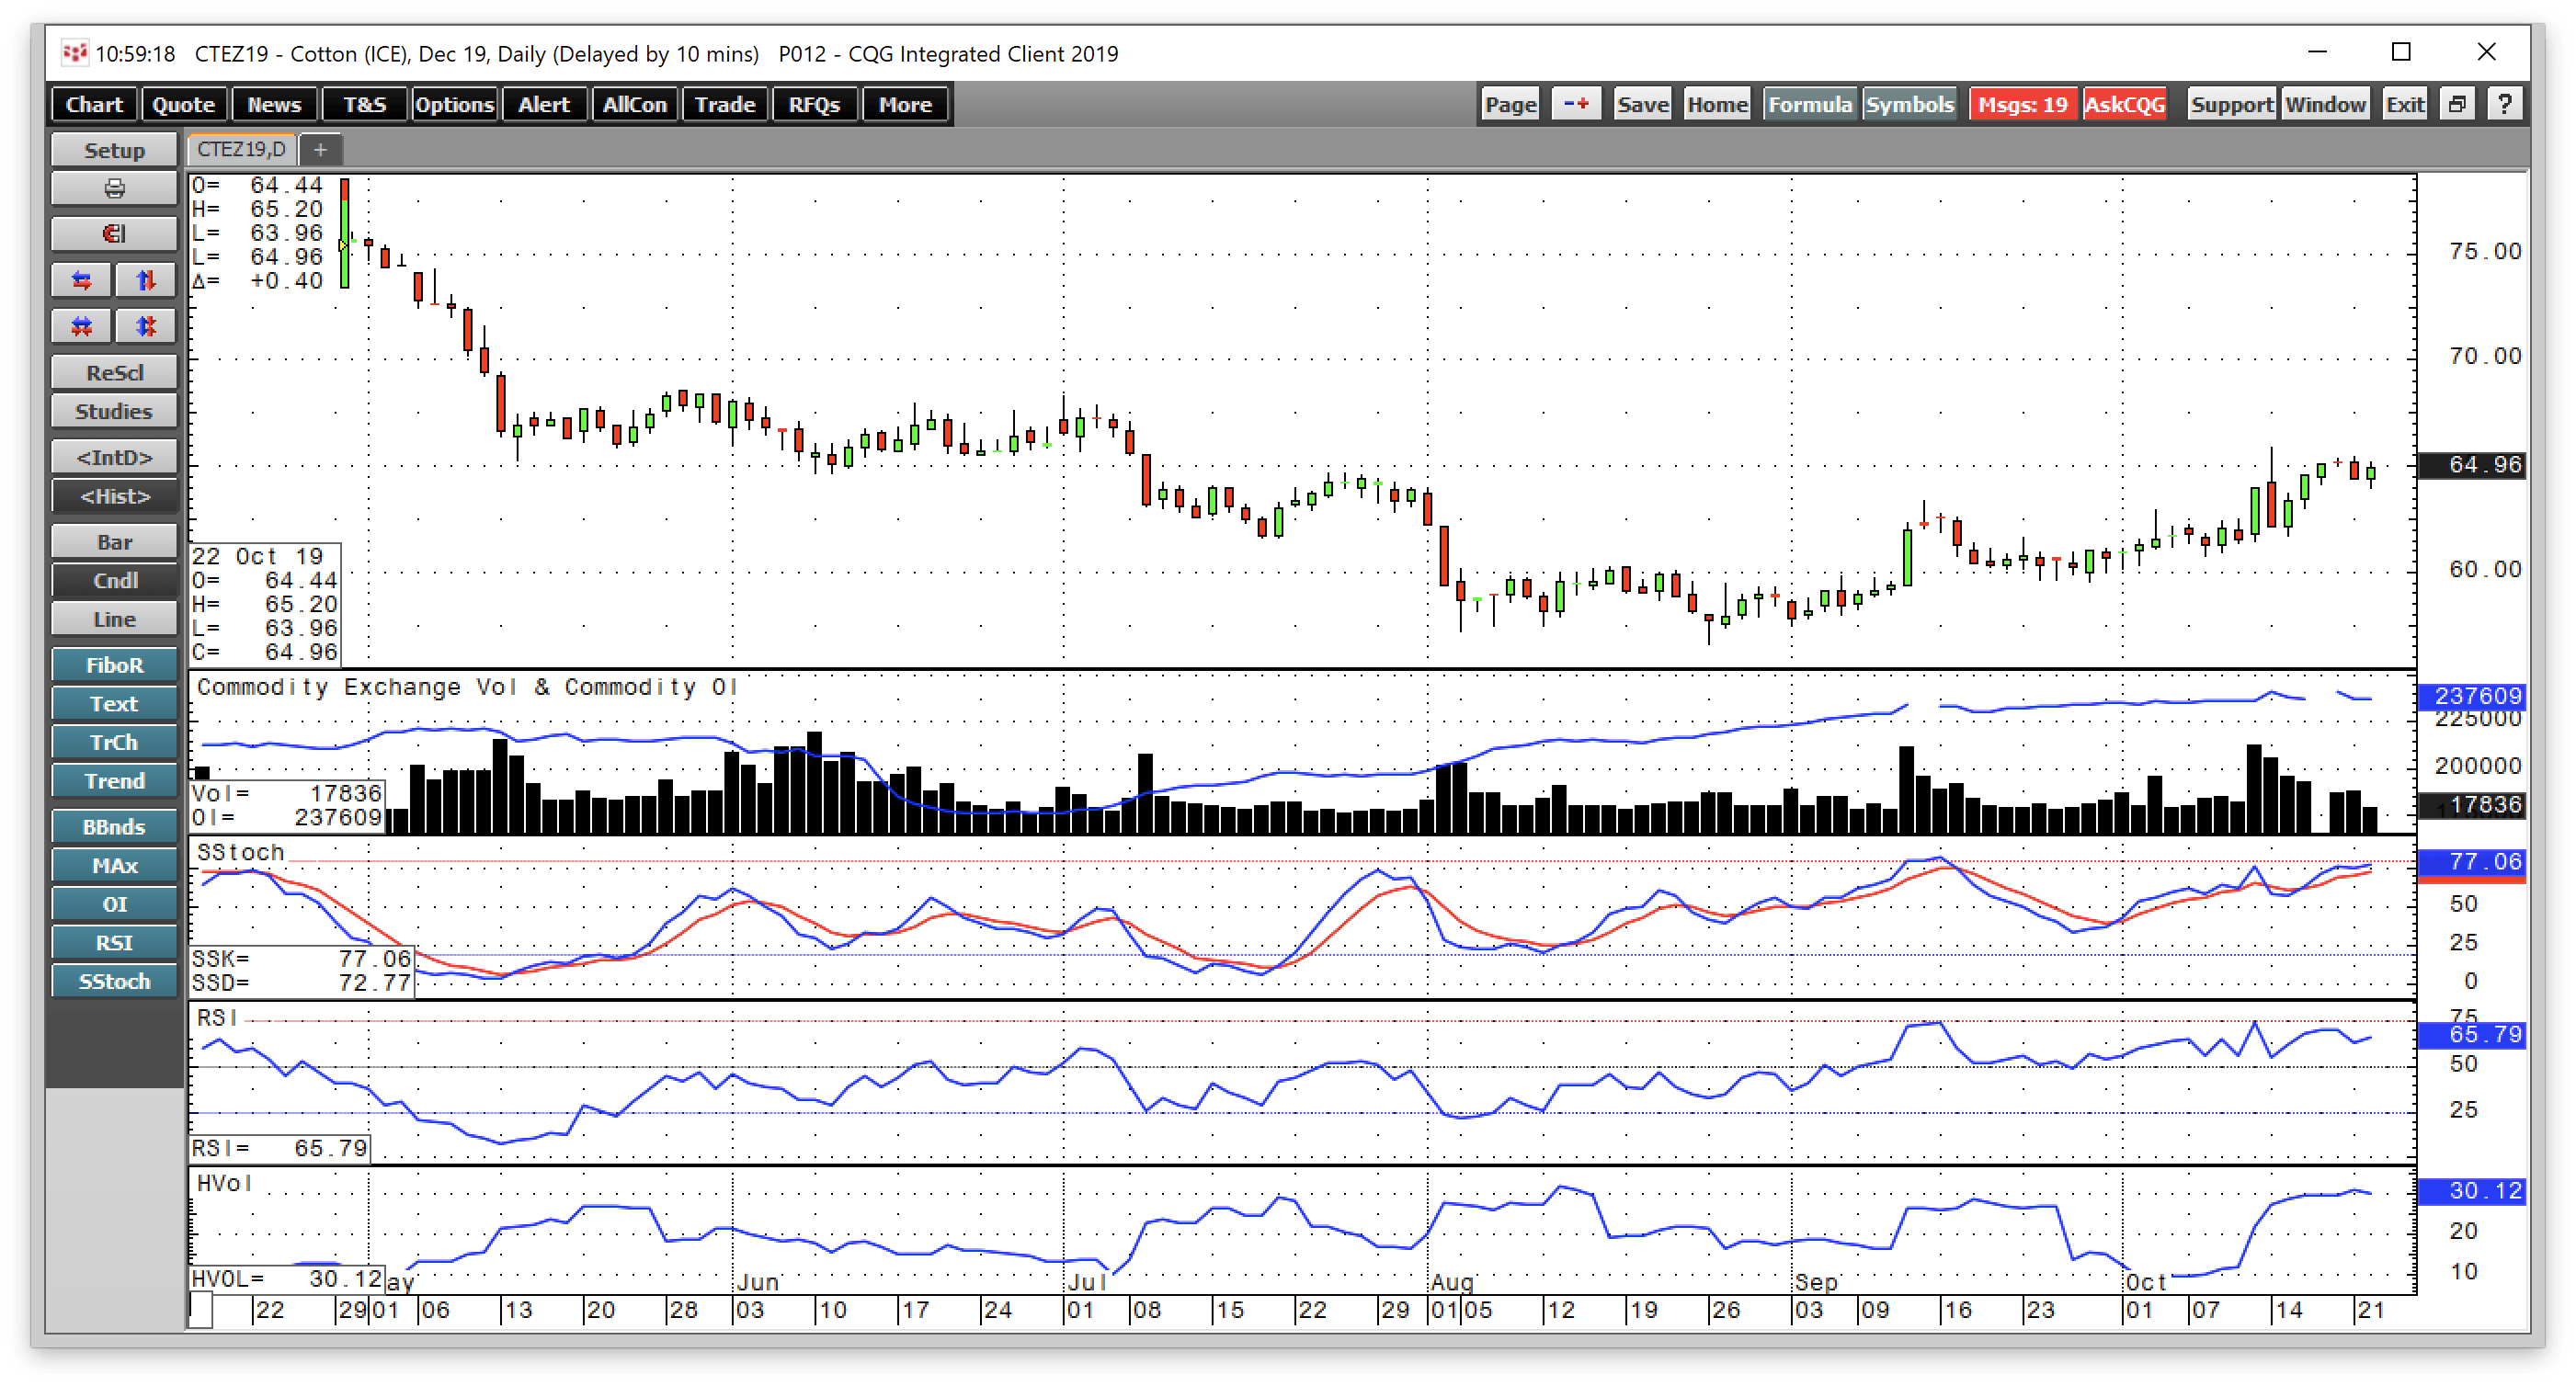
At the same time, the slowdown in China's economy as a result of the US tariffs caused the demand for many raw materials to decline. The rising level of the dollar also contributed to the fall in the price of cotton.
Source: CQG
The weekly chart of the US dollar index shows that the value of the US currency against other world foreign exchange instruments rose steadily throughout July and August. A stronger dollar makes US exports less competitive in global markets. The inverse price relationship between the dollar and commodity prices also weighed on the cotton futures market and sent the price to a half-decade low in August.
"Phase one" of a deal is bullish for cotton
Over the recent weeks, the US and Chinese negotiators continued to talk, and it appears they made somewhat of a breakthrough in October. The potential for a "phase one" deal between the two sides would stop the escalation of tariffs while China would begin to purchase US agricultural products again.
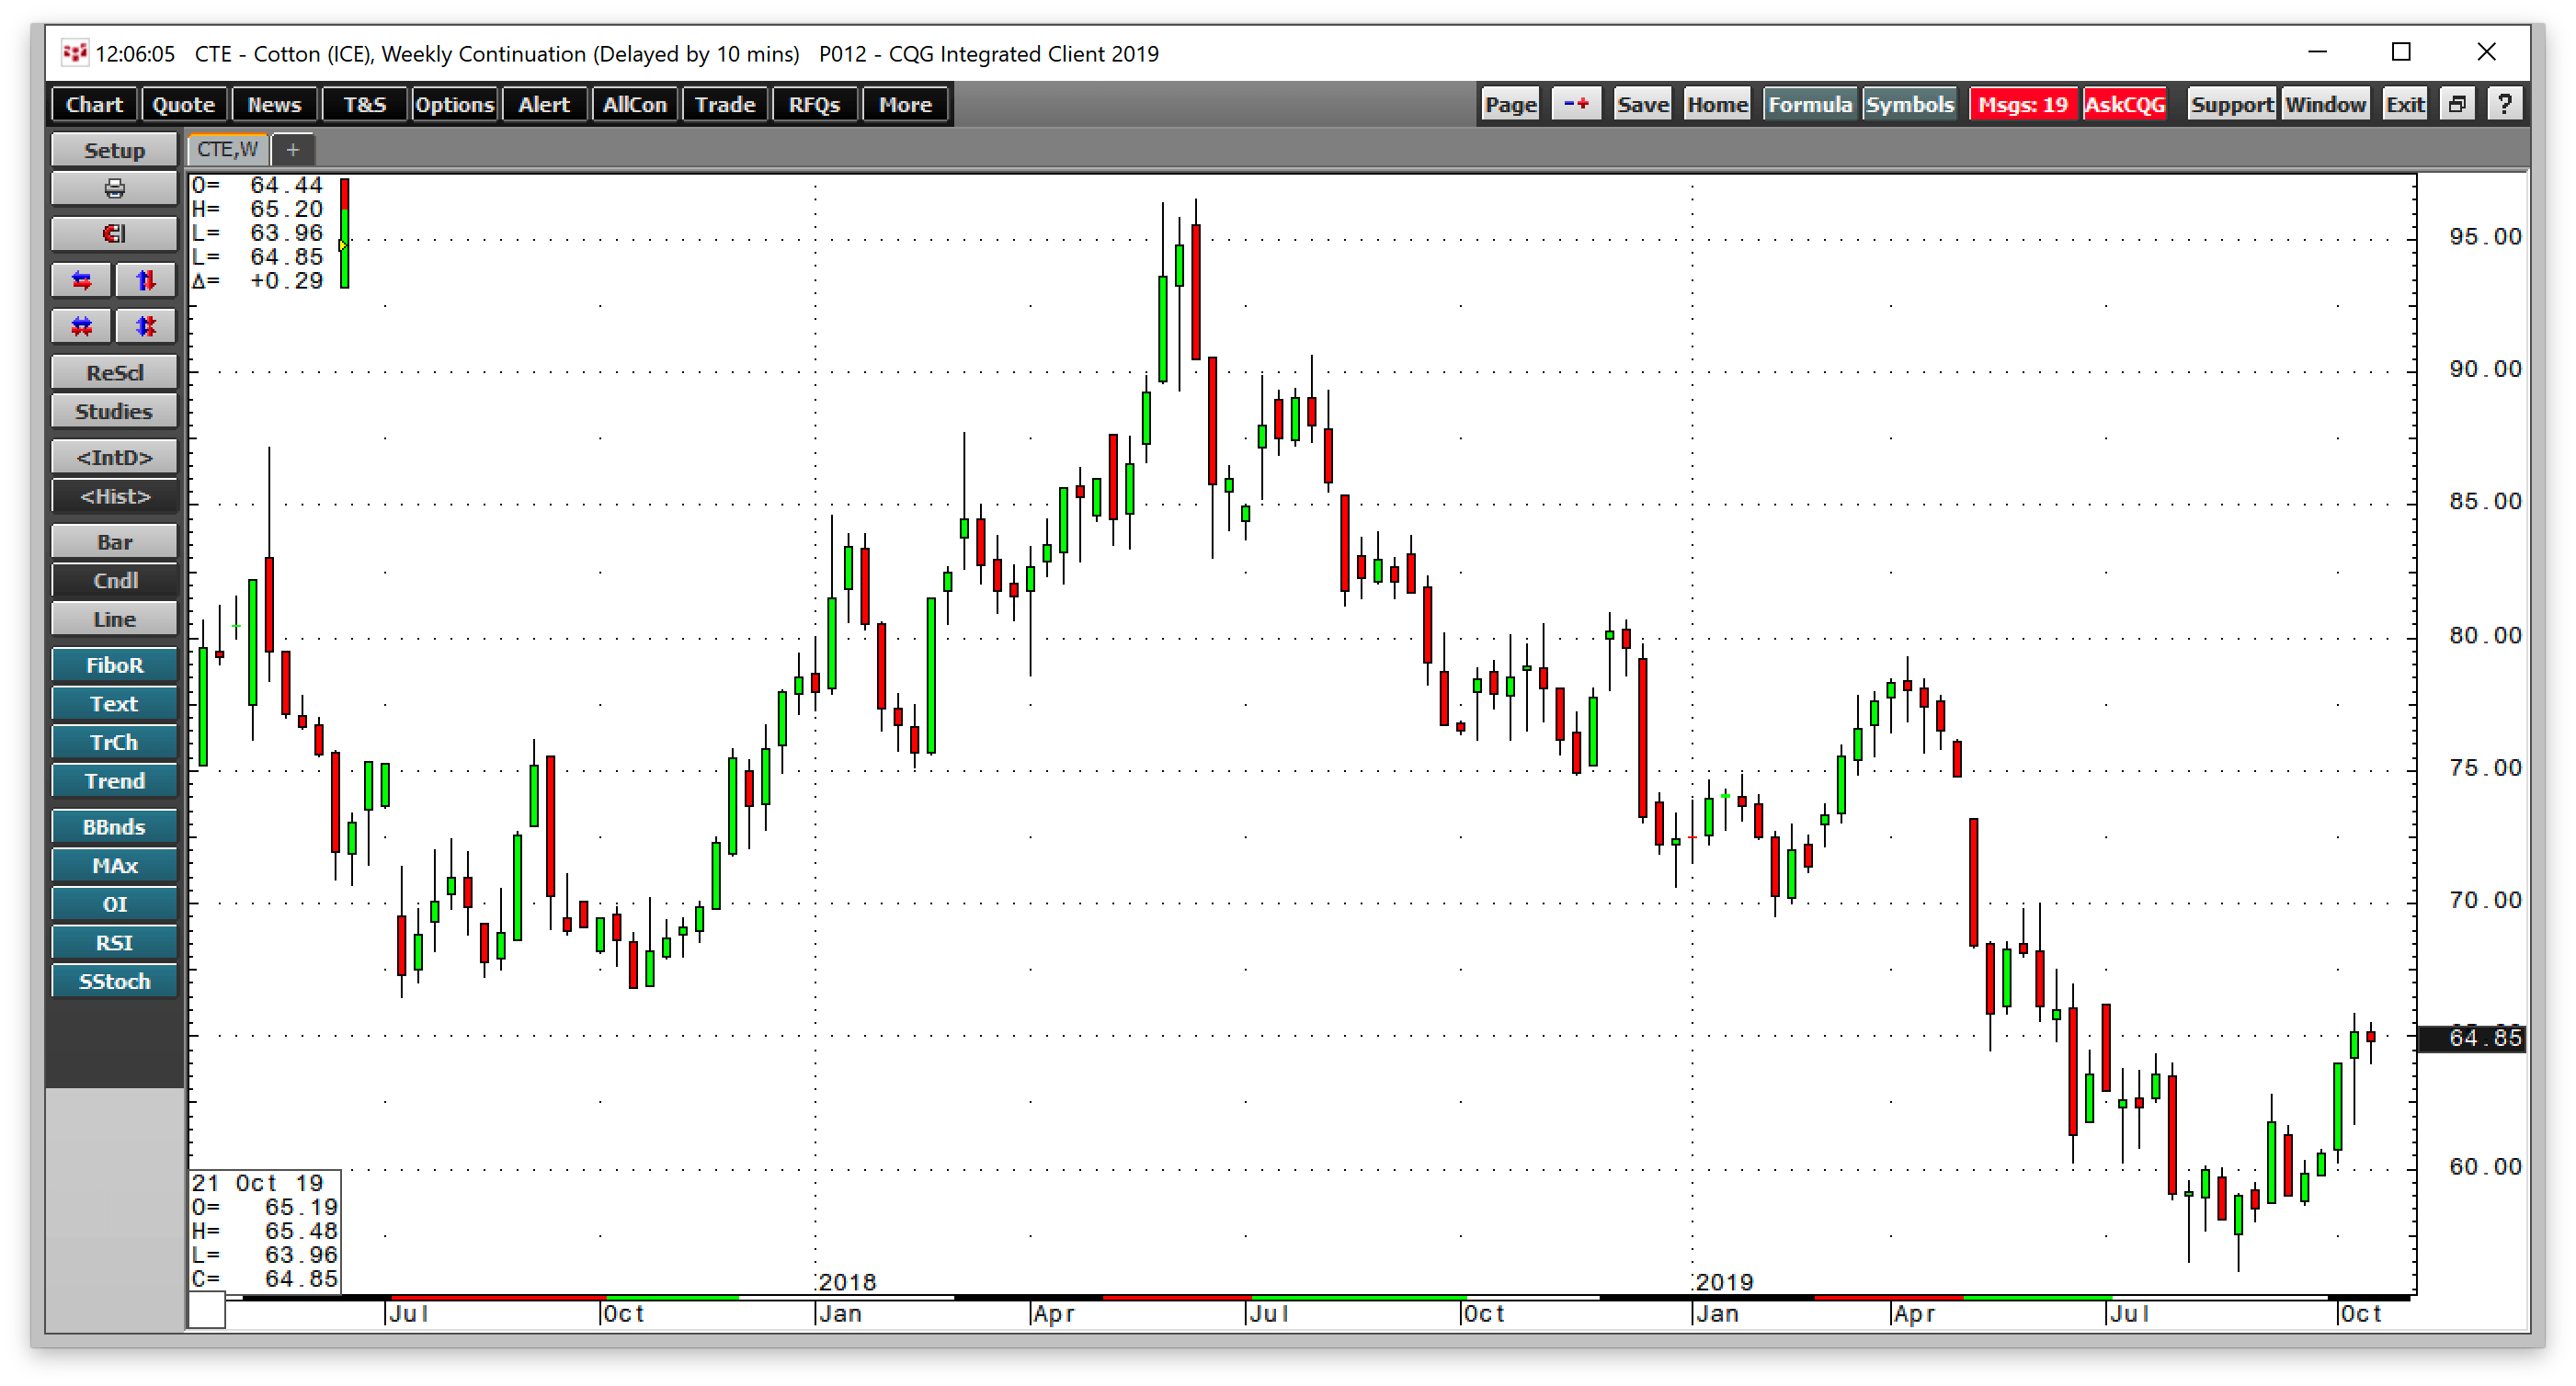
Source: CQG
The weekly chart shows that since late September, cotton posted four consecutive weeks of gains. The fiber futures are now trading at close to the highest price since early July, before the escalation of the trade war.
BAL is the cotton ETF - levels to watch in the cotton futures market
Cotton is a volatile futures market. The next level to watch on the upside is the 70 cents per pound level, the early June peak. Above there, every 10 cents on the upside will likely stand as technical resistance levels. On the downside, the critical price is the March 2016 low at 55.66 cents per pound, which was around ten cents below the current market price at the end of last week.
The most direct route for a risk position in the cotton market is via the futures that trade on the Intercontinental Exchange. Meanwhile, the iPath Series B Bloomberg Cotton Subindex Total Return ETN product provides an alternative. The fund summary for BAL states:
The investment seeks return linked to the performance of the Bloomberg Cotton Subindex Total Return. The ETN offers exposure to futures contracts and not direct exposure to the physical commodities. The index is composed of one or more futures contracts on the relevant commodity (the index components) and is intended to reflect the returns that are potentially available through (1) an unleveraged investment in those contracts plus (2) the rate of interest that could be earned on cash collateral invested in specified Treasury Bills.
Source: Yahoo Finance
The ETN product has been building liquidity over the past months and now has net assets of $11.07 million. BAL trades an average of 7,955 shares each day and charges an expense ratio of 0.45%. The price of December cotton futures rose from 56.59 in August to a high at 65.85 cents per pound in mid-October, a rise of 16.4%.

Source: Barchart
Over the same period, BAL moved from $34.80 to $39.88 per share or 14.6%.
The midpoint of the move from the 2018 high at 96.50 to the August low at 56.19 cents stands at around 76.35 cents per pound. If cotton is on its way to a 50% retracement of the move from the high to the low, the fluffy fiber could have room to run on the upside over the coming weeks and months. The price action since August and the potential for a de-escalation in the trade war between the US and China has injected some signs of bullish life into the cotton market.
The Hecht Commodity Report is one of the most comprehensive commodities reports available today from the #2 ranked author in both commodities and precious metals. My weekly report covers the market movements of 20 different commodities and provides bullish, bearish and neutral calls; directional trading recommendations, and actionable ideas for traders. I just reworked the report to make it very actionable!
Disclosure: I/we have no positions in any stocks mentioned, and no plans to initiate any positions within the next 72 hours. I wrote this article myself, and it expresses my own opinions. I am not receiving compensation for it (other than from Seeking Alpha). I have no business relationship with any company whose stock is mentioned in this article.
Additional disclosure: The author always has positions in commodities markets in futures, options, ETF/ETN products, and commodity equities. These long and short positions tend to change on an intraday basis.
