First, the likely pandemic disruption of fiber market demand from restricted workers/consumers and economic contraction will likely carry into the 21/22 marketing year. Nobody knows for sure, but it strikes me as a long term thing.
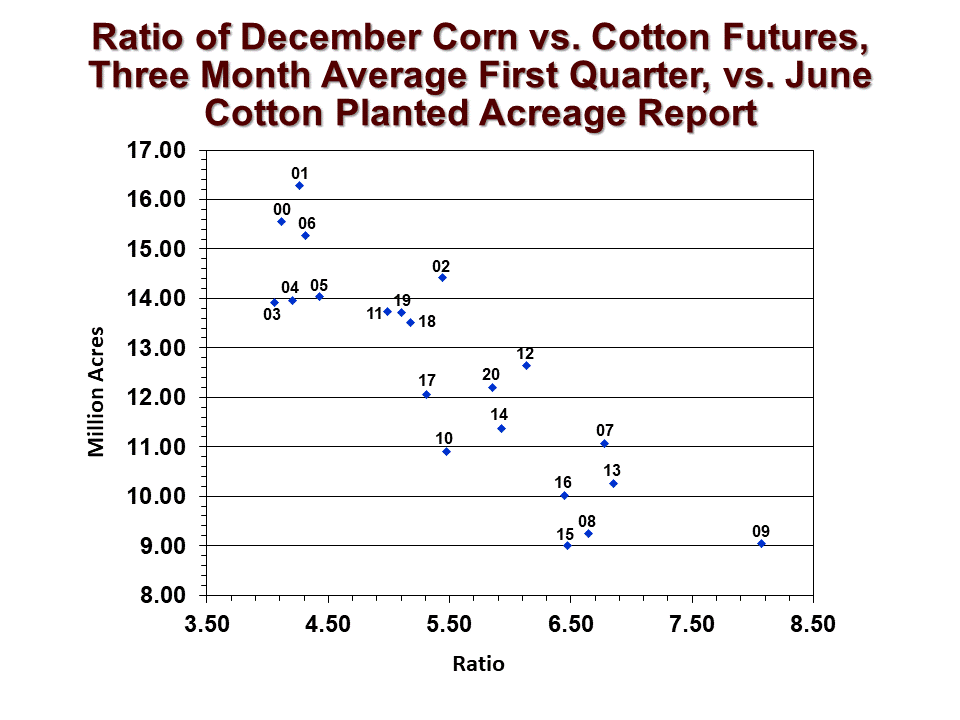
The new crop supply question is more immediate. The 21/22 carry-in could start things off with 4.6 million bales to the U.S. new crop supply. Then there is the planted acreage question. Relative prices (Dec’21 CBOT corn/Dec’21 ICE cotton with a ratio of 5.9 as of January 12) suggest around 12 million acres of U.S. all cotton, based on history (see below).
A more southwestern-specific version of the above chart involves the historical pattern of increasing cotton acres at the expense of hard red winter wheat (see below). This is mostly a consideration in northwestern Texas, Oklahoma, and Kansas. The chart below shows that when the price of wheat, relative to cotton, gets high enough, it is associated with fewer cotton acres being planted. The current ratio of KC Jul’21/ICE Dec’21 cotton prices is 8.2 (as of January 12) which suggests between 6~7M acres of cotton planted in KS-OK-TX. That simply suggests that rising hard red winter wheat futures at present levels might lower southwestern cotton plantings year over year.

The next question concerns moisture and growing conditions. NOAA is forecasting continuation of La Niña conditions through March, and 50:50 odds of returning to neutral during May through June. This implies soil planting conditions may start off dry. That is on top of the currently dry conditions in most of the southern plains region. So we might expect above average abandonment in the spring of 2021. Dry conditions often loop back to influence above average cotton plantings in the southern plains region, especially if the insurance price is established in the mid to upper 70s (which it might be).
So, assuming 12.0 million planted acres, historically high U.S. abandonment (29%), and average yield (850 pounds per acre), we can pencil out around 15 million bale crop and perhaps a 20 million bale supply. Assuming we either export or spin a total of 18 million bales, that leaves around 2 million bales of ending stocks for the 21/22 marketing year. This represents a continuation of year over year reductions in ending stocks, and the resulting level is tight. So we might expect continued price strength in 21/22 compared to the 20/21 marketing year, all other things equal. Statistically speaking, an annual regression of harvest time futures against fundamental and speculative influences predicts that Dec’21 futures will average over 8o cents a pound in the month of October, given a forecast of 11% stocks-to-use (implied above) and assuming the hedge funds are 70,000 contracts net long.
