
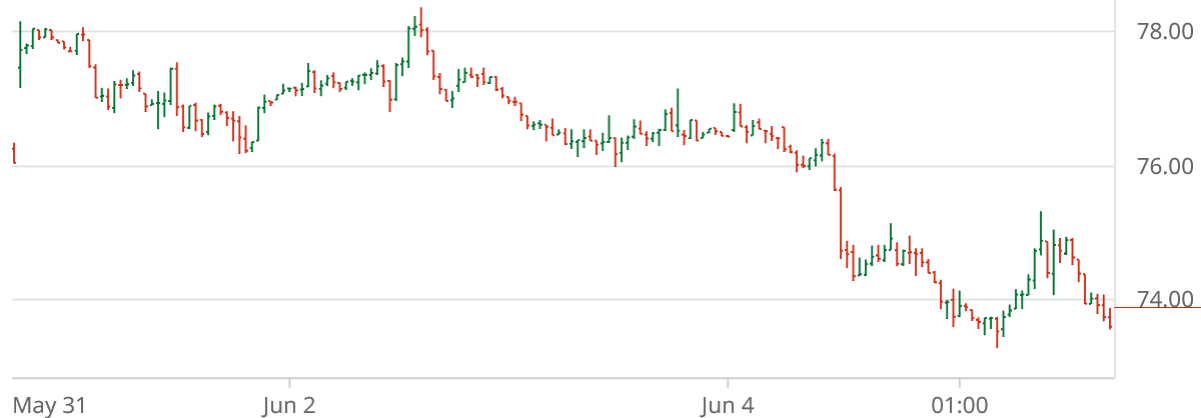
The week ending Friday, June 5 saw ICE cotton futures gap higher on Monday and then weaken. Tuesday saw a recovery to the weekly highs before again weakening and finally stair-step lower (see Jul’26 chart above courtesy of Barchart.com). The nearby Jul’26 contract settled 73.75 cents per pound. The new crop (and most active) Dec’26 settled at 77.48 cents per pound. Chinese cotton prices mostly rose across the week while the A-Index of world cotton prices was mixed.
Other agricultural futures followed similar paths for the week ending June 4. CBOT corn and soybeans, as well as KC wheat futures, all trended steadily lower across the week, reportedly related to grain fundamentals. ICE WTI rose, then peaked and weakened on Thursday. The U.S. dollar index’s pattern resembled oil futures except for a rebound late Thursday.
Cotton-focused news this week included an near-par pace of planting and better moisture conditions. U.S. export net sales as of May 28 were improved but still reflect unspectacular demand. Weekly U.S. cotton export shipments continued to slip below USDA’s export target level. Reported demand indicators included inactive to active spot trading, very light to moderate demand, and light to moderate supplies, all depending on the region. On the other side of the world, various influences (e.g., late/weak monsoon, and reduced world acreage) could paint a tighter global supply picture. The five month suspension of India’s 11% cotton import duty was a bullish influence early this week.
Through Thursday, June 4, the daily shifts in ICE cotton open interest were positive/increasing compared the previous day. The corresponding increase in daily price settlements gave the appearance of new buying, although the regular Tuesday speculative snapshot (represented by the CFTC’s CIT “Supplemental” report for June 2 saw net short speculative positioning. Specifically, there were 392 more hedge fund longs, week over week. This was outweighed by a 3,764 increase in hedge fund shorts compared to last week. Lastly, the index fund net long position changed by a mere 288 contracts, week over week.
The dynamics of ICE cotton futures may also represent a wet blanket on the market, but one that is perhaps lifting. The rising certified stock levels in early 2026, and again in April, could reflect weak commercial demand for U.S. cotton. It remains true that unfixed call sales (representing potential/eventual futures buying by mills) have been at a relatively low level, perhaps reflecting the cautionary buying on the demand side. But more recently, unfixed call sales have been stabilizing/rising (see red line in the chart below). This is bringing them more into balance with unfixed call purchases, and contributing to futures buying.
For more details and data on Old Crop and New Crop fundamentals, plus other near term influences, follow these links (or the drop-down menus above) to those sub-pages.
Πηγή: TAMU