
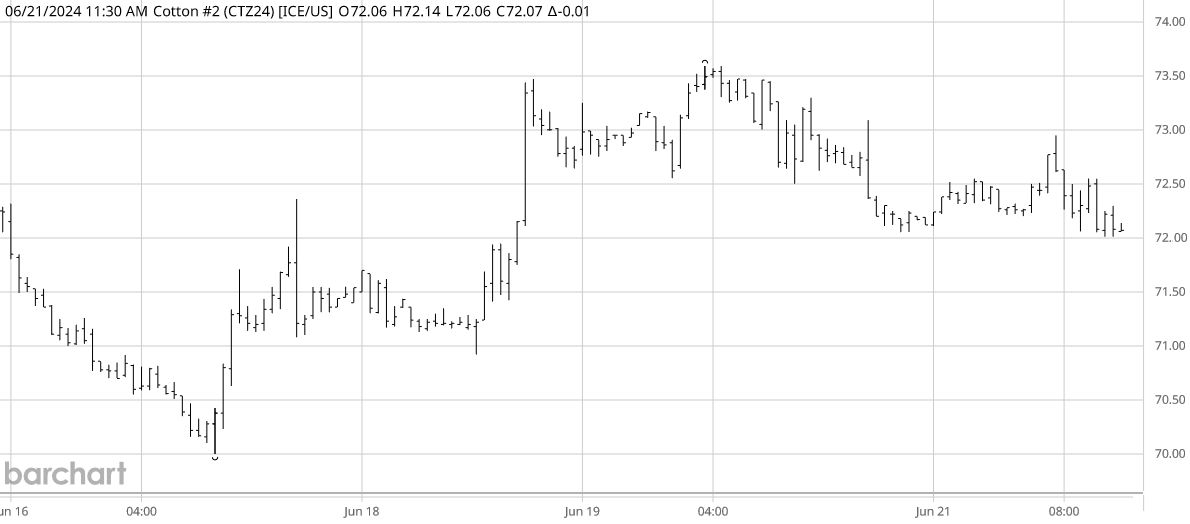
For the holiday-shortened week ending June 21, the most active Dec’24 cotton futures contract slid to 70 cents, then took several steps higher, peaking above 73.50 before finally gliding back towards 72 cents per pound. (see chart above courtesy of Barchart.com). The Dec’24 contract settled Friday at 72.21 cents per pound, down 41 points on the day. Chinese cotton prices eroded and then stabilized. The A-Index of world cotton prices was more flat-to-mixed.
In other ag futures markets, CBOT corn and soybean futures, as well as KC wheat futures, all followed gradual downtrends across the week. The U.S. dollar index started in a gentle downtrend that shifted into an uptrend to end the week. Other macro influences (i.e., GDP, inflation, and interest rate policy) continued to reflect mixed expectations for the general economy.
Cotton-specific influences this week included more scattered rainfall over central and southern Texas, Lousiana and Florida, as well as the TX/OK panhandle regions and Kansas. Speaking of rains, the unfolding Indian monsoon rain pattern arrived early, then stalled, and is now forecast to recover and spread over the important west central cotton growing states. Continued decent weekly U.S. export sales reported this week (through June 13). Actual export shipments were under the needed weekly average pace to reach USDA’s target level of exports. USDA’s weekly summary of the U.S. regional markets reflected inactive/slow trading of physical cotton trading activity and light to moderate demand, across the U.S. regions. Several other standard predictors of U.S. cotton demand are either bearish (low levels of on-call sales) or in a state of flux (rebounding certified stocks).
ICE cotton futures open interest followed a gradually declining pattern across the week ending June 13. New Commitment of Traders data are delayed until June 24. Meanwhile,the most recent weekly (Tuesday June 11) snapshot of speculative positioning showed an increase in short positioning, but not from long liquidation. Rather, the hedge fund long position was barely changed week over week (+366 contracts). However, the hedge fund shorts showed a net increase of 11,251 hedge fund shorts, compared to the previous week. The Index Fund net long position increased by 5,913 contracts week over week, reflecting speculative long positioning. So the week was a mixed bag.
For more details and data on Old Crop and New Crop fundamentals, plus other near term influences, follow these links (or the drop-down menus above) to those sub-pages.
Πηγή: TAMU