
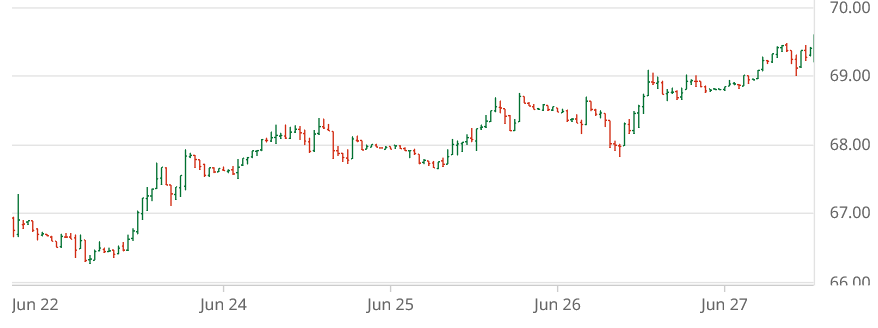
The week ending Friday, June 27 saw ICE cotton futures make a steady march upward to six week highs (see chart above courtesy of Barchart.com). The Dec’25 settled Friday at 69.32 cents per pound, while “Red” Dec’26 settled at 69.75. Chinese cotton prices were flat-to-higher, as was the A-Index of world cotton prices.
Across the week ending June 27, CBOT corn and soybean futures, as well as KC wheat futures all descended in a landing pattern. Keeping with the airline analogy ICE WTI crude oil futures crashed and burned. The U.S. dollar index peaked early and glided lower with mixed economic indicators and concern over the Federal Reserves policy independence. It remains uncertain how financial markets will react as they approach the end of the 90 day hiatus on U.S. tariffs on its trading partners. Other macro influences (i.e., GDP, inflation, and interest rate policy) remained mixed in their expectation and implication.
Cotton-focused market influences this week included continued weekly reports of very light to moderate regional demand for U.S. cotton. There were continued weak old crop U.S. export net sales for the week ending June 19, although this may be more of a function of reported light supplies. However, weekly net sales for the next marketing year were also low at 64,600 bales of upland, which has clearer poor demand implications. The pace of 2024/25 export shipments continued above the weekly average level needed to reach USDA’s target level of exports (11.5 million bales). All of the projected U.S. old crop production has been ginned and classed since about April. New crop influences included continued rains over the central and eastern Cotton Belt, while the early arriving Indian monsoon kicked back in to high gear in the second half of June.
For the week ending Thursday, June 26, the day-to-day shifts in ICE cotton open interest steadily declined. Coupled with the higher futures settlements, this has the appearance of short covering. For what it’s worth, the regular weekly (Tuesday, June 24) snapshot of speculative open interest did show 695 fewer hedge fund short positions. But that was overshadowed by 3,856 additional hedge fund longs, week over week. Moreover, the index trader net long position expanded by 662 contracts, week over week.
ICE cotton daily trading volumes steadily declined across the week ending June 26, perhaps reflecting cautionary positioning going into the weekend prior to Monday’s milestone acreage report by USDA.
The dynamics of ICE cotton futures may also represent a wet blanket on the market. It remains true that unfixed call sales (by mills) are at an historically low level, perhaps reflecting the cautionary buying on the demand side. In terms of ratios, unfixed call purchases (by suppliers) outweigh unfixed call sales by just under two-fold across all contracts, as of June 20.
For more details and data on Old Crop and New Crop fundamentals, plus other near term influences, follow these links (or the drop-down menus above) to those sub-pages.
Πηγή: TAMU