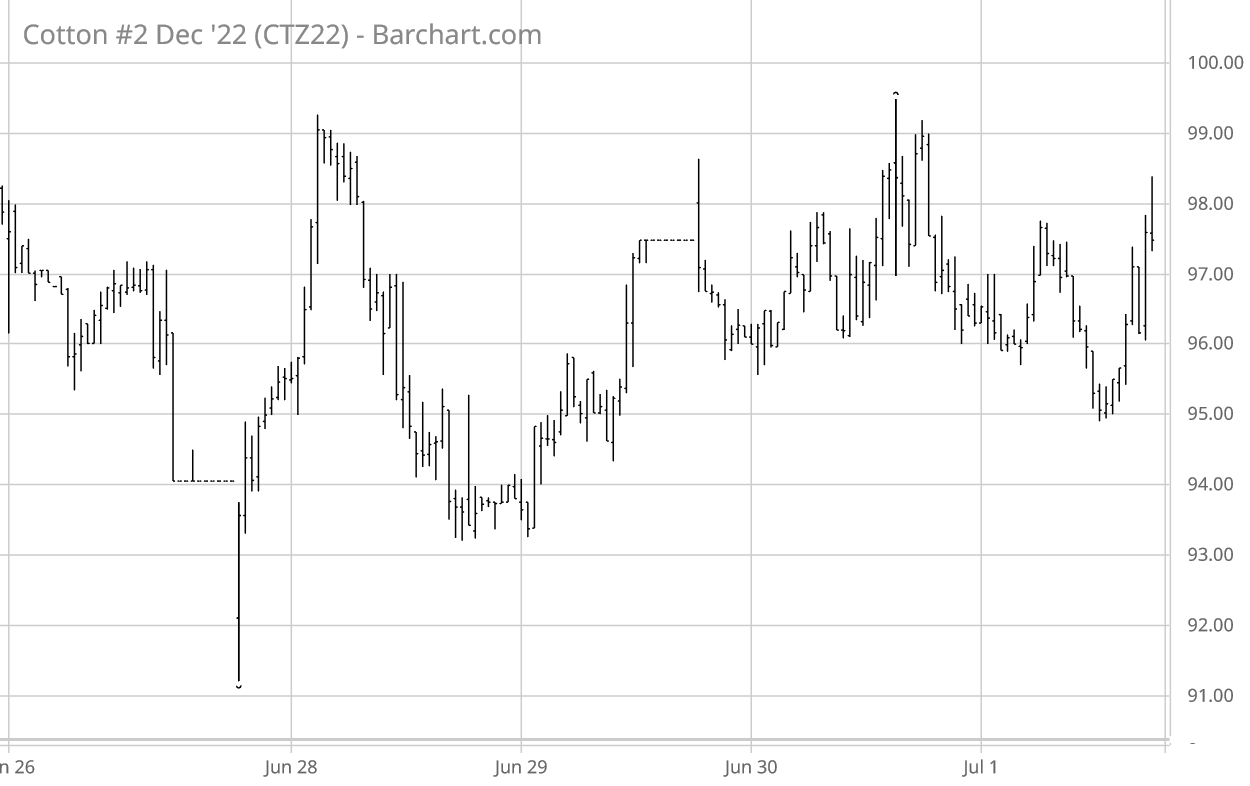
The week week ending Friday, July 1 saw wild, wide, up and down limit moves as the most active Dec’22 bottomed following a 25-cent collapse over the previous week (see chart above courtesy of Barchart.com). Chinese cotton prices and the A-index also nosedived along with ICE futures, although the latter passed the former two on the way down.
Cotton-specific influences this week included some late June moisture along the Texas Gulf Coast, generally hot/dry conditions elsewhere, generally weak demand, weak U.S. cotton export sales, and sub-par export shipments. U.S. squaring and boll setting progress was on par with recent history.
ICE cotton futures open interest was flat across the week. The regular Tuesday snapshot (through June 28) showed some expected (actually, I expected **more**) liquidation with 10,682 fewer hedge fund longs and 3,339 fewer index fund longs , week over week, which was partially offset by 240 fewer hedge fund shorts.
CBOT new crop corn and soybean futures were flat-to-higher, while KC wheat futures saw a bit more of a lift. The U.S. dollar index climbed across the week.
For more details and data on Old Crop and New Crop fundamentals, plus other near term influences, follow these links (or the drop-down menus above) to those sub-pages.
