
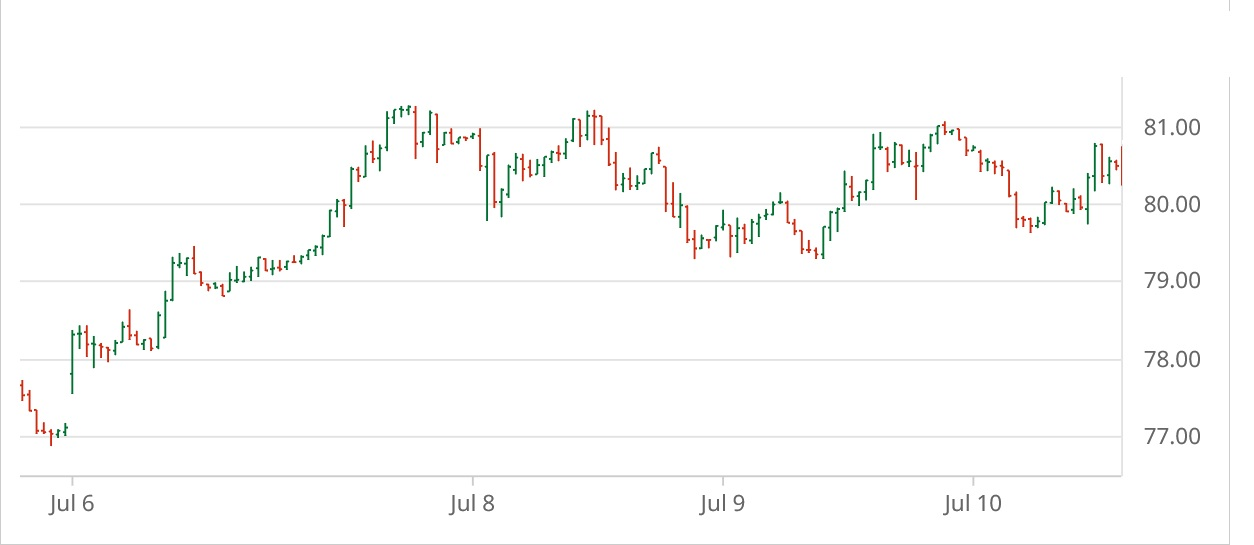
The week ending Friday, July 10 saw ICE cotton futures rise and then level off (see Dec’26 chart above courtesy of Barchart.com). Dec’26 ICE cotton futures settled Friday at 81.54 cents per pound. Chinese cotton prices rose and fell across the week, as did the the A-Index of world cotton prices.
Other agricultural futures followed similar paths through July 9. CBOT corn and soybeans, as well as KC wheat futures, all rose across the first half of the week and then weakened prior to Friday’s WASDE report. WTI oil futures followed a similar pattern to grain futures. The U.S. dollar index mostly trended higher across the week.
Cotton-focused news this week included unsurprisingly higher supply adjustments to the U.S. cotton balance sheet by USDA. There was a second week of minor slippage in cotton crop condition ratings, perhaps influenced by reported extreme heat, and despite scattered rains. U.S. export net sales as of July 2 continued weak. Weekly U.S. cotton export shipments continued below USDA’s export target level. Reported demand indicators included inactive to slow spot trading, very light to moderate demand, and light to moderate supplies, all depending on the region. On the other side of the world, various influences (e.g., South Asian monsoon, and reduced world acreage, particularly in Australia) could paint a tighter global supply picture.
Through Thursday, July 9, the daily shifts in ICE cotton open interest increased compared the previous day. The corresponding increase in daily price settlements gave the appearance of new long positioning, at least early in the week. Indeed, the most recent Tuesday speculative snapshot (represented by the CFTC’s CIT “Supplemental” report for July 7 showed more long positioning. Specifically, there were 10,839 more hedge fund longs, week over week. This was reinforced by a 3,041 decrease in hedge fund shorts compared to last week. Lastly, the index fund net long position expanded by 648 contracts, week over week.
The dynamics of ICE cotton futures may also represent a wet blanket on the market, but one that is perhaps lifting. The rising certified stock levels in early 2026, and again since April, could reflect weak commercial demand for U.S. cotton. For what it’s worth, the week ending July 9 saw a large reduction in the certified stock level. It remains true that unfixed call sales (representing potential/eventual futures buying by mills) have been at a relatively low level, perhaps reflecting the cautionary buying on the demand side. But more recently, unfixed call sales have been stabilizing/rising (see red line in the chart below). This is bringing them more into balance with unfixed call purchases, and contributing to futures buying.
For more details and data on Old Crop and New Crop fundamentals, plus other near term influences, follow these links (or the drop-down menus above) to those sub-pages.
Πηγή: TAMU