
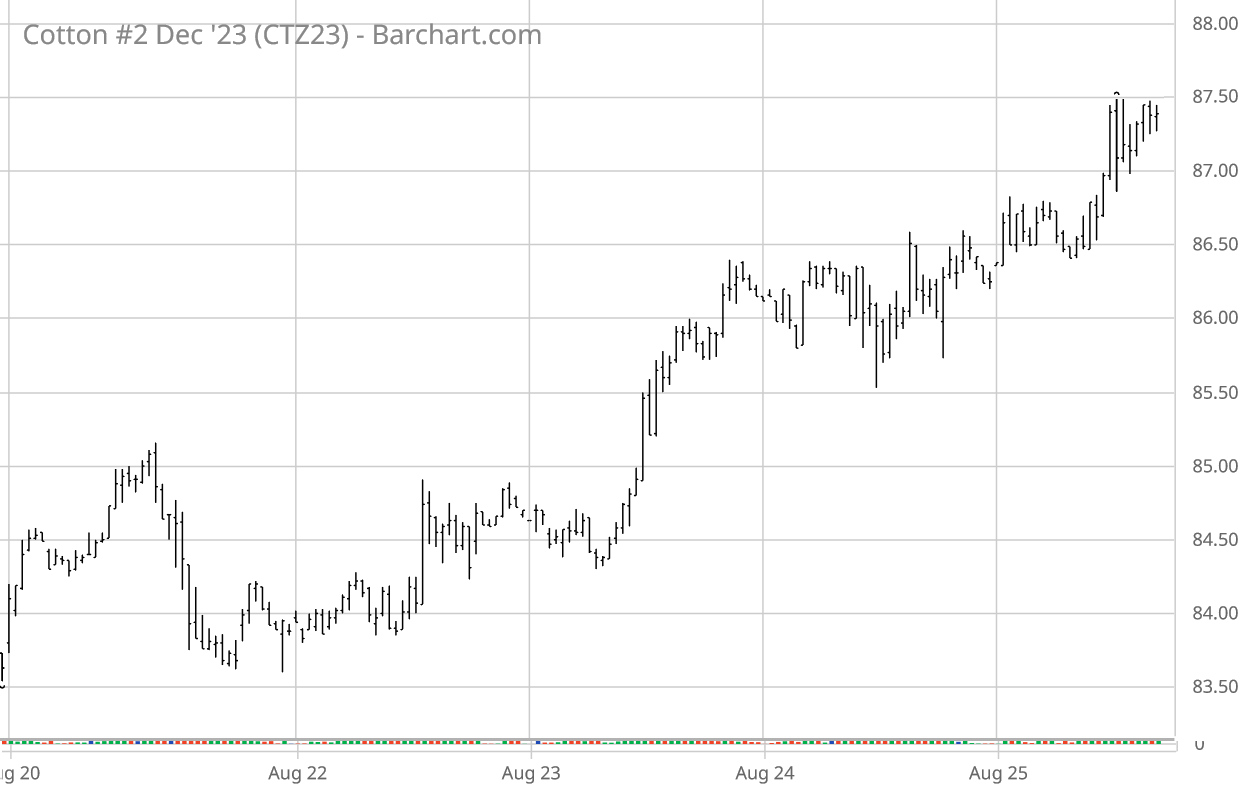
For the week ending Friday, August 25, ICE cotton futures first traded sideways within the now familiar mid-80s range. Then at midweek, prices began a modest rally up over two cents, with the Dec’23 settling Friday at 87.31 cents per pound (see chart above courtesy of Barchart.com). Chinese cotton prices rose this week as did A-Index of world cotton prices.
Other agricultural futures markets like CBOT corn, CBOT soybean, and KC wheat futures showed variations on a v-shape pattern. The U.S. dollar index followed a steeply gyrating sideways pattern. Other macro influences (i.e., GDP, inflation, and interest rate policy) remain a potential headwind to longer term cotton demand. An example of this was the global risk off selling due to the Chinese economic downturn during the week ending August 18.
Cotton-specific influences this week focused on the intense heat dome over the center of the U.S. bordered by a ring of showers that included Tropical Storm Harold on the southern flank. I expect the latter to have minimal impact to the hopefully mostly harvested South Texas crop. The Texas regional summary continued to highlight hot and dry conditions (click here and scroll past the feature article). Looking back, the excess moisture in April/May had mixed effects in northwestern Texas, followed as it was by record heat. The resulting production uncertainty is still clouding the U.S. cotton supply/demand and market outcomes.
On the other side of the world, the southwest monsoon rains were relatively early in their complete coverage of India, albeit a bit below average in their early accumulation. July saw an intense flooding rains in northern India and Pakistan. Now the monsoon rainfall appears to be in a lull, with the major west central cotton growing regions showing a rainfall deficit. This maintains concerns about the agricultural impact of an historically dry August. Pakistan suffered crop damage from the excessive monsoon rains, and perhaps also from the more recent dryness. China’s main cotton producing region of Xinjiang had to deal with damaging temperature extremes. Meanwhile the U.S.’s two major export competitors in the southern hemisphere have been harvesting strong cotton crops.
There were very weak U.S. export sales for the second full week of the new marketing year (through August 17). Actual export shipments were below the needed weekly average pace, but this is seasonally normal. USDA’s weekly summary of the U.S. regional markets continued to reflect mixed spot physical trading activity and very light to moderate demand, across the U.S. regions.
ICE cotton futures open interest declined across the week and then bottomed. In combination with higher ICE cotton settlements, this had the appearance of short covering — at least later in the week. In contrast, early in the week appeared to be the tail end of short positioning. The regular snapshot of speculative positioning (through Tuesday, August 22) showed 5,343 fewer hedge fund longs, as well as a 1,758 decrease in the net long index fund position. This liquidation was reinforced by 700 new hedge fund shorts, compare to the previous Tuesday.
For more details and data on Old Crop and New Crop fundamentals, plus other near term influences, follow these links (or the drop-down menus above) to those sub-pages.
Πηγή: TAMU