
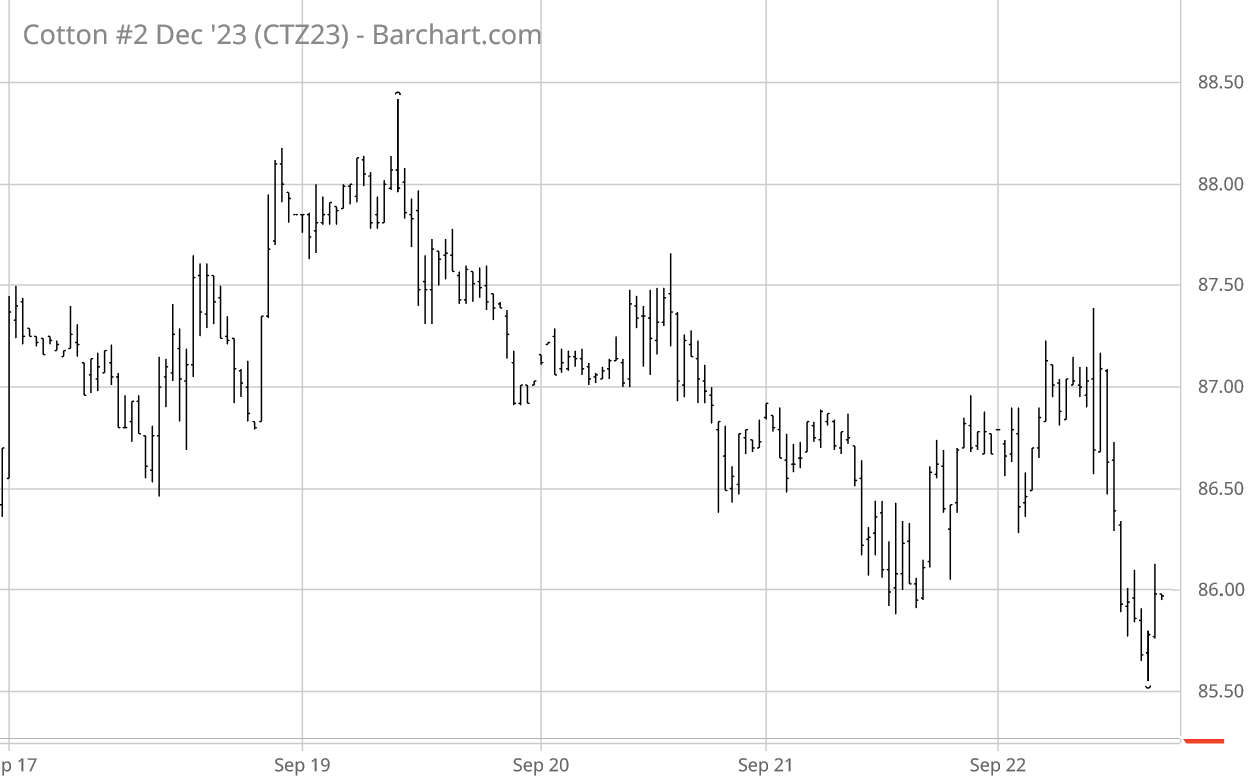
For the week ending Friday, September 22, ICE cotton futures gyrated sideways-to-lower (see chart above courtesy of Barchart.com). The Dec’23 settled down 56 points on Friday at 85.91 cents per pound. In other words, still within the longstanding range. Chinese cotton prices and the A-Index of world cotton prices were more mixed.
Other agricultural futures markets like CBOT corn gyrated sideways, while CBOT soybean and KC wheat futures trended modestly lower across the week. The U.S. dollar index traded sideways through midweek and then rose steadily through Friday. Other macro influences (i.e., GDP, inflation, and interest rate policy) remain a potential headwind to longer term cotton demand.
Cotton-specific influences this week were not readily apparent. The Southern Plains region saw scattered showers which also were widespread over the Southeastern states. The latest Texas regional summary highlight the effects earlier rainfall in spots (click here for the feature article and regional breakdown).
U.S. export sales through September 14 were stronger than in previous weeks, but still modest in their levels. Actual export shipments were below the needed weekly average pace, but this is seasonally normal. USDA’s weekly summary of the U.S. regional markets continued to reflect mixed spot physical trading activity and very light to moderate demand, across the U.S. regions. Several standard predictors of cotton demand are not encouraging, e.g., rising certified stocks and historically low levels of on-call sales.
ICE cotton futures open interest rose modestly across the week, while the pattern of price settlements was mixed. The regular snapshot of speculative positioning (through Tuesday, September 19) showed 3,876 fewer hedge fund longs, but also 2,090 fewer (covered) hedge fund shorts, week over week. The net long index fund position increased by 2,089 compared to the previous Tuesday. So the speculative positioning reflects a mixed bag.
For more details and data on Old Crop and New Crop fundamentals, plus other near term influences, follow these links (or the drop-down menus above) to those sub-pages.
Πηγή: TAMU