Report Highlights:
The MY 2017/18 Turkish cotton planting estimate is up 18 percent to 470,000 hectares and production is up 23 percent to 870,000 MT (4 million bales). Domestic cotton consumption for MY 2017/18 is projected to be 1.55 MMT (7.1 million bales), up about eleven percent. Imports are expected to remain strong in MY 2017/18, about the same as last year at 800,000 MT (3.67 million bales), in spite of the increasing local availability of cotton. Around half of the cotton imports to Turkey are from the United States, despite the three percent antidumping duty.
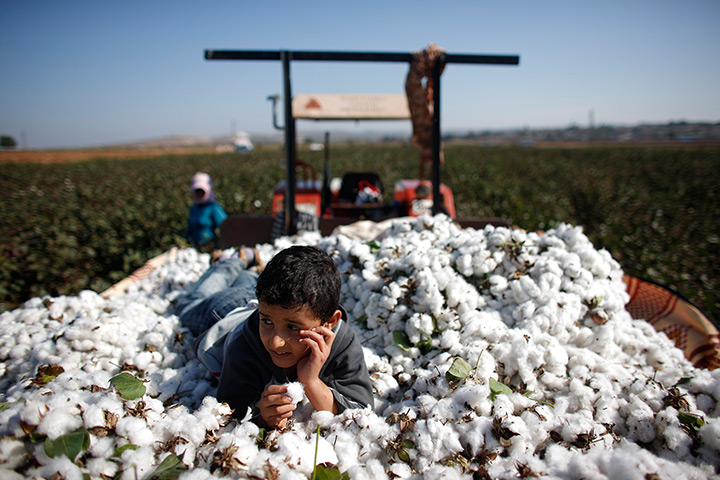
Production
The MY 2017/18 Turkish cotton planting and production are estimated at 470,000 hectares and 870,000 MT (4 million bales). Planting is up about eighteen percent and production is up twenty-three percent compared to the last crop year. This was due to the attractive returns compared to other crops, such as corn, which stimulated an increase in planting. In the GAP region, where more than fifty percent of local cotton is produced, yields were high despite the repeated planting in some areas at the beginning of the season. High quality seeds were used and favorable weather during the picking season helped raise yields. Growing conditions in Cukurova region were also favorable. In the Aegean region, while planting was up about twenty percent compared to MY 2016/17, production was up only fifteen percent due to pest problems in some areas. In recent years, Turkish farmers have been improving their field yields by increasing utilization of high quality certified seeds, taking measures to prevent insect attacks, and using an increasing amount of cotton harvesters. Also, advancements in seed technology have enabled farmers to plant second crop cotton, following wheat and other field crops, which helped to increase overall planting. Cultivation of genetically engineered crops is not allowed in Turkey, based on the country’s Biosafety Law and implementing regulations, which went into effect in 2010.
The GAP project is progressing with a slow pace, but when finished, aims to irrigate about 1.3 million hectares of land in South East Anatolia. In MY 2017/18, only a marginal area, about 10,000 hectares, was able receive irrigation water for the first time. However, in some areas where the main canal is completed, farmers draw water from the canal to replace their use of well water for farming, hence cutting their production costs.
In Turkey, corn and cotton are competing crops for planting area. To promote cotton planting, the Turkish government has been increasing the seed cotton production bonus during the last six years. Corn support however was reduced in MY 2016/17 and remained the same in MY 2017/18. Accordingly, MY 2017/2018 seed cotton production support increased to TL 0.80 per kilogram (around 9 cents per pound in USD) from TL 0.75 per kilogram a year ago (as of 11/11/2017 US$ 1= 3.85 TL). The support is provided only to certified seed users. Corn support is TL 0.20 per kilogram.
Turkey became part of the BCI (Better Cotton Initiative) four years ago and final production for MY 2017/18 is expected to be 40,000 MT.
Consumption
Domestic consumption is expected to go up to 1.55 MMT (7.1 Million bales) in
MY 2017/18, up about eleven percent compared to last marketing year. This is due to the significant new investments of Turkish mills to increase their capacities to meet the increasing demand from domestic and international markets. Turkish mills have been investing in new machinery and technology to increase quality and lower costs to get ahead in the very competitive international textile trade.
Turkey’s increasing youth population, immigration to urban areas, and rapid growth in number of shopping malls with textile outlets significantly increased the total volume of textiles sold in the Turkish domestic market. An increased number of tourists visiting Turkey from neighboring Middle Eastern countries also contributed to local sales of textiles. Turkish textile producers are increasing their store numbers in export markets, such as the Middle East, North Africa, and Europe, to penetrate more to the markets that they are in.
The rise in exports to Turkey’s traditional markets, such as Europe and Russia, and also in new markets such as Iran, will help to support the domestic cotton consumption in the future as well.
The industry is asking the Turkish government to take steps against the increasing amount of imported low cost cotton yarn which is expected to reach 200,000 MT during CY 2017. According to sources, the government is expected to impose new restrictions on imported yarn starting from CY 2018 which will support domestic cotton consumption.
Trade
Total cotton imports for MY 2016/17 were 801,000 MT (3.67 Million bales). Turkey sourced about forty-seven percent of their imported cotton from the United States, which was about 380,000 MT (1.75 million bales) despite the three percent anti-dumping surcharge on U.S. cotton. Brazil (85,000 MT), Turkmenistan (78,000 MT) and Greece (75,000 MT) were the other leading suppliers during the same period. About 26,000 MT of Syrian cotton also found its way to the Turkish market, despite turmoil in that region.
During the first two months of MY 2017/18, which are August and September, total imports were 165,000 MT, of which 82,000 MT was U.S. cotton. Australia (31,000 MT), Burkina Faso (11,000 MT), Brazil (10,000 MT) and Benin (8,000 MT) were the other leading suppliers.
The vast majority of Turkey’s cotton is used domestically, but during MY 2016/17, Turkey’s cotton exports were about 32,200 MT. Bangladesh (10,800 MT), Indonesia (5,800 MT), and Vietnam (5,800 MT) were the leading foreign destinations for Turkish cotton. About 1,500 MT of cotton was also exported to the Mersin and Kayseri Free Trade Zone with a possibility of being re-imported later. Turkey also exported about 40,000 MT (183,000 bales) of hydrophilic cotton for medical use during the same period, which added to exports in the PSD.
PSD, Turkey, Cotton, Bales (1000 Hectares, 1000 bales)
| Cotton | 2015/2016 | 2016/2017 | 2017/2018 | |||
| Market Begin Year | Aug 2015 | Aug 2016 | Aug 2017 | |||
| Turkey | USDA
Official |
New
Post |
USDA
Official |
New
Post |
USDA
Official |
New
Post |
| Area Planted | 0 | 0 | 0 | 0 | 0 | 0 |
| Area Harvested | 370 | 370 | 400 | 400 | 460 | 470 |
| Beginning Stocks | 1596 | 1050 | 1583 | 929 | 1678 | 967 |
| Production | 2650 | 2662 | 3200 | 3236 | 3800 | 4000 |
| Imports | 4218 | 4215 | 3679 | 3676 | 3400 | 3670 |
| MY Imports from U.S. | 0 | 1512 | 0 | 1748 | 0 | 1835 |
| Total Supply | 8464 | 7927 | 8462 | 7841 | 8878 | 8637 |
| Exports | 231 | 231 | 334 | 334 | 275 | 345 |
| Use | 6650 | 6770 | 6450 | 6540 | 6750 | 7115 |
| Loss | 0 | 0 | 0 | 0 | 0 | 0 |
| Total Dom. Cons. | 6650 | 6770 | 6450 | 6540 | 6750 | 7115 |
| Ending Stocks | 1583 | 929 | 1678 | 967 | 1853 | 1177 |
| Total Distribution | 8464 | 7927 | 8462 | 7841 | 8878 | 8637 |
PSD, Turkey, Cotton (Hectares, MT)
| Turkey
Cotton (HECTARES)(MT) |
||||||
| 2015/1 6 | Revised | 2016/1 7 | Estimate | 2017/1 8 | Forecast | |
| Post Old | Post Estimate
New |
Post old | Post Estimate
New |
Post Old | Post Estimate
New |
|
| Market Year Begin | August 2015 | August 2016 | August 2017 | |||
| Area Planted | 37000
0 |
370000 | 40000
0 |
400000 | 46000
0 |
470000 |
| Area Harvested | 37000
0 |
370000 | 40000
0 |
400000 | 46000
0 |
470000 |
| Beginning Stocks | 22883
0 |
228830 | 20181
0 |
201810 | 22181
0 |
210001 |
| Production | 58000
0 |
580000 | 70500
0 |
705000 | 82000
0 |
870000 |
| Imports | 91830
7 |
918307 | 77500
0 |
801007 | 72500
0 |
800000 |
| MY Imp. from U.S. | 32938
4 |
329384 | 40000
0 |
380820 | 38000
0 |
380000 |
| TOTAL SUPPLY | 17271 37 | 1727137 | 16818 10 | 1707817 | 17668 10 | 1880001 |
| Exports | 50327 | 50327 | 60000 | 72816 | 65000 | 75000 |
| USE Dom.
Consumption |
14750 00 | 1475000 | 14000 00 | 1425000 | 14500 00 | 1550000 |
| Loss Dom.
Consumption |
0 | 0 | 0 | 0 | 0 | 0 |
| TOTAL Dom. Consumption | 14750 00 | 1475000 | 14000 00 | 1425000 | 14500 00 | 1550000 |
| Ending Stocks | 20181
0 |
201810 | 22181
0 |
210001 | 25181
0 |
255001 |
| TOTAL
DISTRIBUTION |
17271 37 | 1727137 | 16818 10 | 1707817 | 17668 10 | 1880001 |
|
Import Trade Matrix |
Turkey | ||
| Commodity | Cotton | Units: | Metric Tons |
| Time Period | Aug/July | Aug/Sept | |
| Imports for: | MY2016/17 | MY 2017/18 | |
| U.S. | 380820 | U.S. | 81961 |
| Others | |||
| Brazil | 84830 | Australia | 31271 |
| Turkmenistan | 77538 | Burkina Faso | 10860 |
| Greece | 74685 | Brazil | 10003 |
| Syria | 25691 | Benin | 8118 |
| Burkina Faso | 24721 | Sudan | 4191 |
| Sudan | 17322 | Cameroon | 3389 |
| Azerbaijan | 17106 | Mali | 3316 |
| Tajikistan | 14772 | Azerbaijan | 2272 |
| Australia | 14189 | Turkmenistan | 1455 |
| Argentina | 9986 | Argentina | 1176 |
| Total of Others | 360840 | 76051 | |
| Others not listed | 59347 | 6636 | |
| Grand Total | 801007 | 164648 | |
| Commodity | Cotton | Units: | Bales |
| Time Period | Aug/July | Aug/Sept | |
| Imports for: | MY2016/17 | MY 2017/18 | |
| U.S. | 1747963 | U.S. | 376201 |
| Others | |||
| Brazil | 389370 | Australia | 143534 |
| Turkmenistan | 355900 | Burkina Faso | 49847 |
| Greece | 342804 | Brazil | 45914 |
| Syria | 117920 | Benin | 37262 |
| Burkina Faso | 113470 | Sudan | 19237 |
| Sudan | 70508 | Cameroon | 15555 |
| Azerbaijan | 78516 | Mali | 15220 |
| Tajikistan | 67803 | Azerbaijan | 10428 |
| Australia | 65127 | Turkmenistan | 6678 |
| Argentina | 45835 | Argentina | 5398 |
| Total of Others | 1656255 | 349073 | |
| Others not listed | 272402 | 30460 | |
| Grand Total | 3676622 | 755734 |
