2019/20 UPLAND COTTON SITUATION AND OUTLOOK
(Based on the October 2019 WASDE-USDA Estimate)
Area and Production
U.S. upland cotton production for the 2019 crop (August 2019 - July 2020 marketing year) is forecast at 20.98 million 480-pound bales (4.6 MMT), up 19 percent from 2018/19, and above the 5-year average of 16.5 million bales (3.6 MMT).
Planted area in 2019/20 totaled 5.48 million hectares, down two percent from the previous year. Harvested area is forecast at 4.97 million hectares, suggesting an abandonment rate of 9 percent, down from over 25 percent in 2018/19. Yield per harvested hectare is forecast at 919 kilograms, slightly below the 5-year average of 939 kg/hectare.
Less abandonment and more favorable weather conditions in Texas prompted harvested area up more than a third from the previous year. Upland production was up in all major producing states except Kansas and New Mexico.
Domestic Mill Use
In 2019/20, mill use of upland cotton is projected at 3.0 million bales (648 thousand metric tons), up slightly from the previous year.
Foreign Trade
For 2019/20, upland cotton exports are projected at 15.8 million bales (3.45 MMT), a 12 percent increase from the previous year. The U.S. share of world exports of all cotton is expected to increase to over 38 percent.
Exports for 2018/19 were 14.1 million bales (3.07 MMT), down slightly from 2017/18. For a fourth consecutive year, the top export destination was Vietnam, which accounted for roughly a quarter of shipments. The top ten upland markets (in descending order) were Vietnam, Turkey, China, Pakistan, India, Indonesia, Bangladesh, Mexico, Thailand, South Korea. The top ten destinations represented nearly 90 percent of U.S. upland cotton exports.
U.S. upland cotton imports in 2018/19 were less than 1,000 bales.
Supply and Stocks
The 4.64 million bale (1.01 million metric tons) beginning stocks in 2019/20 are up 13 percent from the previous year. Ending stocks for 2019/20 are forecast at 6.76 million bales (1.47 million metric tons), up 46 percent from 2018/19 and the highest in 12 years.
Inter-fiber Competition
Total U.S. domestic cotton consumption increased in calendar 2018 to its highest level since 2010. U.S. cotton mill use reached 1.5 billion pounds in 2018, slightly below 2017. U.S. cotton textile and apparel product imports and exports moved in opposite directions in 2018. U.S. textile and apparel imports reached 9.0 billion pounds, 4 percent above a year earlier and the highest in eight years. Meanwhile, cotton textile and apparel exports decreased 3.5 percent in 2018 to 1.6 billion pounds, the lowest in nine years. As a result, total U.S. domestic consumption of cotton in 2018 reached 8.8 billion pounds, 4 percent above a year earlier and the highest since 2010’s 9.9 billion pounds.
Textile and apparel imports of synthetic fiber products increased 7 percent from 2017 to a record 10.4 billion pounds in 2018. Synthetic products accounted for 50 percent of the total U.S. textile and apparel product imports in 2018, with cotton contributing an additional 43 percent. Meanwhile, synthetic product exports reached 1.6 billion pounds in 2018, marginally above 2017. Synthetic products accounted for 47 percent of the total U.S. textile and apparel product exports in 2018, similar to cotton’s share.
Overall, cotton accounts for less than one-third of total U.S. fiber consumption, continuing the downward trend of the past decade. Likewise, cotton fiber spun in the U.S. textile industry follows a similar downward trend. Meanwhile, U.S. per capita consumption of cotton totaled an estimated 27 pounds per person in calendar 2018, slightly above the previous two years. However, less than 5 pounds of this total was spun in the United States, roughly half the level spun in 2005.
UPLAND 2018 CROP
2018 Prices:
Spot cotton quotations for color 41, leaf 4, staple 34, mike 35-36 and 43-49, strength readings of 27.0-28.9 grams per tex, uniformity of 81 units in the designated spot markets averaged 69.92 cents per pound for the 2018-2019 season, down from 75.70 cents for the 2017-2018 season. The season’s highest daily quotation for the base quality occurred on August 2, 2018 at 85.65 cents per pound and the season’s lowest quotation was 55.28 cents on July 18, 2019. The highest monthly average for the marketing year was 80.75 cents per pound in August 2018 and the lowest was 58.08 cents per pound in July 2019.
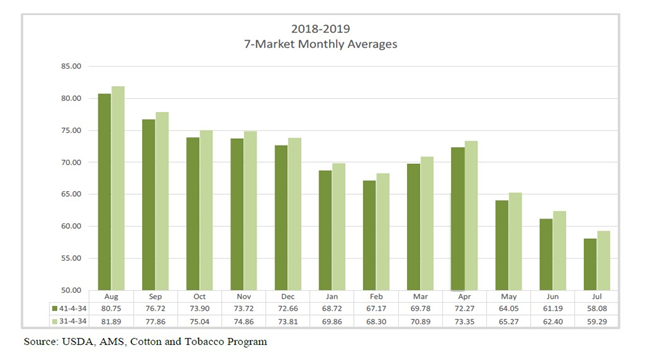
Quotations for color 31, leaf 3, staple 34, mike 35-36 and 43-49, strength readings of 27.0-28.9 grams per tex, uniformity of 81 units in the designated spot markets averaged 71.07 cents per pound for the 2018-2019 season, down from 76.65 cents for the 2017-2018 season.
The average price received by farmers for Upland cotton in 2018-19 was 70.30 cents per pound in the 2018-2019 marketing year. The 2017-2018 marketing year average price was 68.60 cents, compared with 68.00 cents in the 2016-2017 marketing year, according to the National Agricultural Statistics Service, USDA. The marketing year average price is monthly prices weighted by monthly marketings during the period August through the following July, with no allowances for unredeemed loans.
Spot cotton transactions for Upland and Pima in the designated markets totaled 1,283,283 running bales in the 2018-2019 marketing year, down from 2,060,426 bales in the 2017-2018 marketing year and 1,570,646 bales in 2016-2017.
Qualities 2018 Crop:
Color
The predominant color grade of Upland cotton classed from the 2018 crop was color grade 41, accounting for 38.0 percent of classings, according to the USDA, Agricultural Marketing Service, Cotton and Tobacco Program. Color grades 11&21 accounted for 7.9 percent of classings; color grade 31, 29.4 percent; color grades 51,61 and 71, 5.5 percent. In the white color grades, color 41 and better made up percent of 75.3 classings, down from 88.3 percent in 2017. All white color grades accounted for 80.8 percent of the 2018 crop, down from 89.4 percent in 2017. Light Spotted color grades comprised 16.1 percent of classings, up from 8.4 percent in 2017. Spotted, Tinged, Yellow Stained and Below Grades accounted for about 2.8 percent of classings this season, up from 2.3 percent in 2017.
Leaf
The predominant leaf grade of Upland cotton classed from the 2018 crop was leaf grade 3, accounting for 41.0 percent of Upland classings. Leaf grade 3 was also the predominant leaf grade a year earlier, making up 41.7 percent of classings. Leaf grade 4 comprised the next highest percentage from the 2018 crop at 34.0 percent against 21.1 percent a year ago. Leaf grades 1 and 2 made up 12.3 percent of classings of the 2018 crop, compared with 30.5 percent in 2017. Leaf grade 5 made up 10.6 percent of classings, up from 5.8 percent in 2017. Leaf grades 6,7 and 8 made up 2.3 percent of classings, up from 0.9 percent last year.
Staple
The average staple length of Upland cotton classed from the 2018 crop was 36.54 thirty-seconds of an inch, up from 36.40 a year ago. The predominant staple length was 37, accounting for 28.9 percent of classings. Staples 32 and shorter comprised 0.6 percent of classings. Please see table below.
Staple: Percent: | 28 & Shorter | 29 | 30 | 31 | 32 | 33 | 34 | 35 | 36 | 37 | 38 | 39 | 40 & Longer |
* | * | * | 0.1 | 0.5 | 1.9 | 6.6 | 15.1 | 22.1 | 28.9 | 16.0 | 7.0 | 2.0 |
* is less than 0.05 percent
Mike
The average Mike of Upland cotton classed from the 2018 crop was 4.4, up from 4.1 last year. Please see table below.
MIKE | 3.4 & Below | 3.5 to 3.9 | 4.0 to 4.5 | 4.6 to 5.0 | 5.1 & Higher |
Percent | 5.7 | 11.8 | 41.5 | 36 | 5.9 |
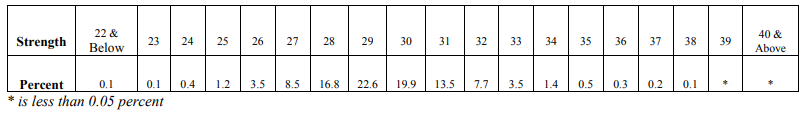
Strength
The average fiber strength of Upland cotton classed from the 2018 crop was 29.90 grams per tex (gpt), down from 30.3 a year ago. Please see table below.
Cotton Ginnings
Ginnings of 2018-crop cotton in the United States totaled 17.9 million running bales, according to the Cotton Ginnings 2018 Summary report released on May 10, 2019 by the Agricultural Statistics Board, National Agricultural Statistics Service, USDA. This number is down 12 percent from the 2017 season. There were 532 active cotton gins during the 2018 season, down from the 553 gins that operated in 2017. Sixty percent of the gins processed more than 20,000 running bales compared with 69 percent the previous season.
Varieties Planted 2018 Crop:
The Deltapine brand of Upland cottonseed was the most popular planted in the United States for the 2019-2020 season, according to the USDA, Agricultural Marketing Service's Cotton and Tobacco Program. The Americot brand was the second most popular followed by Phytogen, BASF-FiberMax, ALL-TEX/DYNAGRO, BASF-Stoneville, CROPLAN, and Miscellaneous.
Deltapine brand varieties were the most popular planted in 2019, accounting for 41.0 percent of the United States acreage. This brand accounted for 53.6 percent of the acreage planted in the southeastern states (Alabama, Florida, Georgia, North Carolina, South Carolina, and Virginia). It accounted for about 78.0 percent in the south central states (Arkansas, Louisiana, Mississippi, Missouri, and Tennessee), 25.4 percent in the southwestern states (Texas, Oklahoma, and Kansas), and 38.7 percent in the western states (Arizona, California, and New Mexico). Deltapine's most popular varieties were DP 1646 B2XF, DP 1518 B2XF, DP 1845 B3XF, and DP 1820 B3XF, accounting respectively for 22.3, 3.7, 3.4, and 1.9 percent of the U.S. Upland cotton acreage.
Americot brand varieties were the second most popular planted in 2019, accounting for 22.8 percent of the United States acreage. These varieties accounted for 14.2 percent of the acreage planted in the southeastern states, 6.7 percent in the south central states, 31.4 percent in the southwestern states, and 0 percent in the western states. The most popular Americot varieties were NG 4545 B2XF , NG 4777 B2XF, NG 3406 B2XF, and NG 5711 B3XF, accounting respectively for about 3.6, 3.3, 2.6, and 1.8 percent of the United States acreage planted to Upland cotton.
Phytogen brand varieties were the third most popular planted in 2019, accounting for 17.8 percent of the United States acreage. They accounted for 19.2 percent of the acreage planted in the southeastern states, 5.9 percent of the acreage in the south central states, 20.6 percent in the southwestern states and 24.2 percent in the western states. The most popular Phytogen brand varieties were PHY 350 W3FE, PHY 480 W3FE, PHY 444 WRF, and PHY 330 W3FE, accounting respectively for 2.6, 2.0, 1.8, and 1.5 percent of the United States acreage planted to Upland cotton.
BASF-FiberMax brand varieties were the fourth most popular planted in 2019. These varieties accounted for about 6.6 percent of the acreage planted. They accounted for 0 percent of the acreage planted in the southeastern states, 0 percent of the acreage in the south central states, 10.3 percent in the southwestern states and 27.6 percent in the western states. The most popular BASF-FiberMax varieties were FM 1830 GLT, FM 2007 GLT, FM 1911 GLT, and FM 1953 GLTP, accounting respectively for 1.4, 1.0, 0.8, and 0.7 percent of the United States acreage planted to Upland cotton.
ALL-TEX/DYNA-GRO brand varieties were the fifth most popular and accounted for about 5.5 percent of the U.S. acreage planted in 2019. BASF-Stoneville varieties were the sixth most popular and accounted for about 3.8 percent of the 2019 cotton acreage. CROPLAN varieties were the seventh most popular and accounted for about 2.2 percent of the 2019 cotton acreage.
Phytogen was the most popular brand of American Pima varieties planted in 2019. Phytogen variety PHY 881 R accounted for 76.4 percent of the United States Pima acreage. Hazera's HA 1432 was the second most planted American Pima variety and accounted for 6.8 percent of the U.S. crop. Phytogen's PHY 841 R was the next most popular variety and accounted for 6.0 percent of the U.S. Pima acreage.
Estimates of the percentage of the various varieties of cotton planted in the United States for 2019 were based on informal surveys made by the Cotton and Tobacco Program Classing Offices. Those surveyed included ginners, seed dealers, extension agents, and other knowledgeable sources.
ORGANIC COTTON MARKET SUMMARY
2018 Production
The 2018 organic Upland and American Pima cotton production in the US totaled 23,483 bales according to information collected from organic producers, marketing associations, and gins that process organic cotton. Production increased by 2,587 bales from the previous year. An additional 329 transitional bales were reported. Production was concentrated in West Texas with additional acreage in New Mexico. Bayer CropScience FM 958 and AFD 2485 were the predominate varieties.
Cottonseed
Organic cottonseed prices ranged from 400 to 525 dollars per ton. This compares to 155 to 225 dollars per ton for conventional cotton. Cottonseed yields ranged from 500 to 800 pounds of seed per bale of ginned lint. Most of the cottonseed was sold to organic dairies. Some was saved for replanting and organic fertilizer. Other uses include products for human consumption.
